
Inside the advance third quarter GDP report, the details in most of the important categories suggested slowing after two quarters consistent with “reflation” at least in its third try. If the economy swings between shallow downturns and often shallower upturns, these subcategories give us some insight as to why. Overall, growth remains at a level that is not growth, whether consumers or business investment.
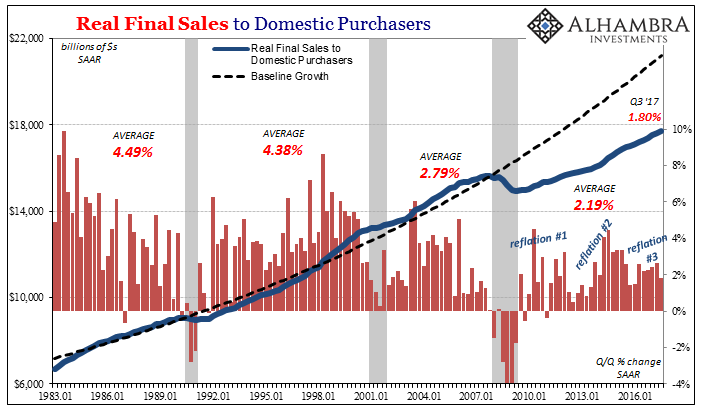
Real Final Sales to Domestic Purchasers, a measure of US demand regardless of where the goods/services originated, increased by just 1.80% (Q/Q SAAR) in Q3. That was the lowest rate of expansion since Q1 2016 and the near-recession trough. It doesn’t bode well for future growth both as a reflection of incomes and the labor market but also the slight uptick in inventory detected by GDP also in the third quarter. That’s a potential problem for domestic producers as well as those overseas (China).
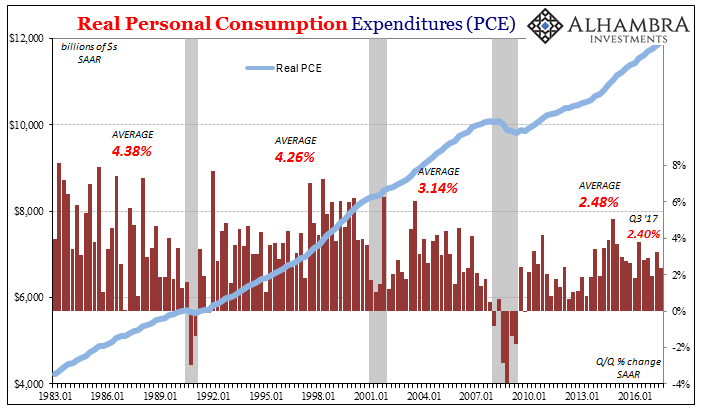
In terms of consumers alone, Real PCE growth remains stuck around and less than 2.5%. That’s substantially less than consumer spending growth that propelled actual economic advancement in the latter 20th century (with the eurodollar-fueled debt of the 2000’s serving as the initial transition to what we have now). In the media this is classified as “strong” and “resilient” when in fact it shows just how much trouble American workers have as compared to prior periods.
Most concerning of all is business investment. Real Private Non-residential Fixed Investment (PNFI) is a measure of capex, perhaps the broadest for the overall US economy. Quarter-over-quarter, PNFI rose by just 3.9% (SAAR) in Q3, a notable slowing from Q1 and Q2. Neither of those prior two quarters was all that solid to being with.
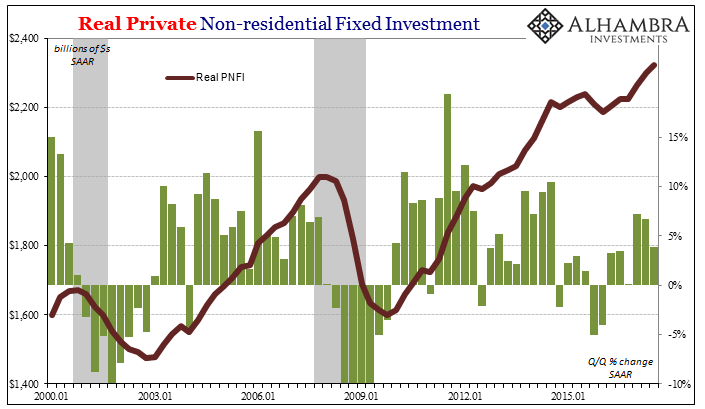
It is here where the so-called supply side or economic potential originates, and it is here where these upturn/downturn cycles are most evident – and therefore disquieting.


Leave A Comment