One of the major hallmarks of the Bull Run after the financial crisis was the lack of volatility. The implications of this lack of volatility has been dire. In the past few quarters, the trading revenues from big investment banks has fallen while others have been forced out.
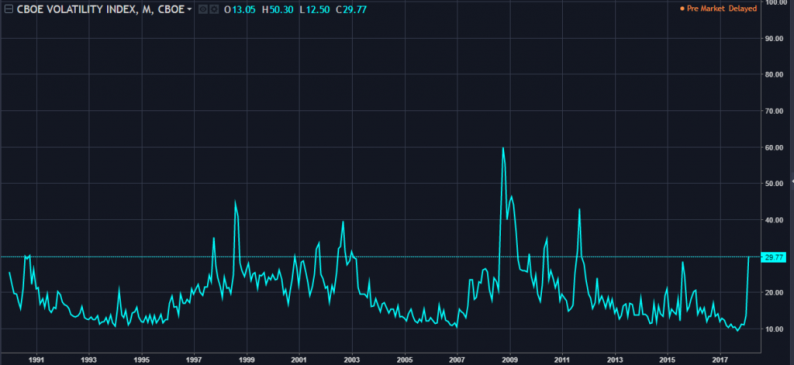
As shown in the chart below, the Chicago Board’s volatility index peaked in 2008 when it soared to slightly below 100. After the peak, the index started declining. Last year, it spent all its time at the all-time low level.

Surprisingly, it was at these prices when global risks were rising. For example, the VIX had very little movements even when North Korea tested its missiles. It remained at historically low levels even when Trump was threatening fire and fury to North Korea. It also remained low at a time when hurricanes and fires engulfed a significant part of the United States.
All these were signs of complacency among investors. By being complacent, they believed that markets would always move up. They bought the dips whenever they happened.
For traders, the lack of volatility was a bit difficult because it was near possible to make trading decisions. How do you do comprehensive technical analysis when financial assets are only moving up?
The lack of volatility also attracted many traders to the risky world of cryptocurrencies. Most people who rushed to buy bitcoins and other cryptocurrencies knew nothing about them. All this pushed cryptocurrencies to almost a trillion dollar valuation before they started to crash in January.
To measure the volatility or fear in the financial markets, traders use the CBOE Volatility index, also known as VIX.
This index was started in 1993 by CBOE. At the time, the index was created to measure the expectations of the 30-day volatility implied by at-the-money S&P 100 index option prices. Later, the CBOE teamed with Goldman Sachs to update the VIX model. The updated VIX is based on the S&P 500. It estimates the expected volatility by averaging the weighted prices of the S&P 500 puts and calls over different strike prices.


Leave A Comment