So far, so-so.
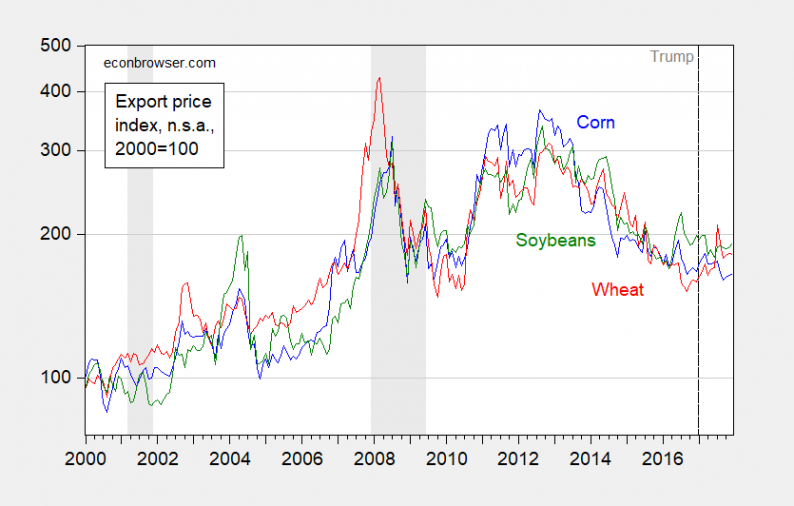
Export prices trending sideways.
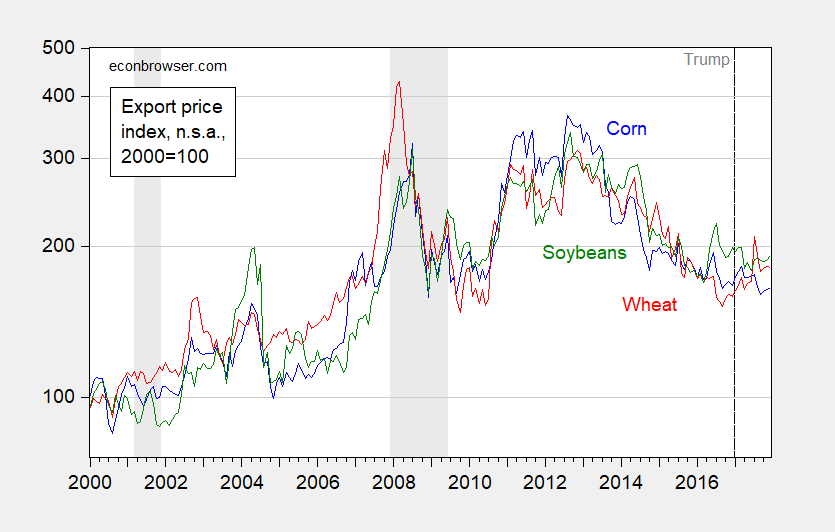
Figure 1: Export price of wheat (red), corn (blue), and soybeans (green). NBER recession dates shaded gray. Source: BLS via FRED, NBER, and author’s calculations.
Farm income trending sideways.

Figure 2: Net farm income, in billions of 2017$, deflated by CPI. 2017 estimate from USDA as of Nov. 29, 2017, deflated by CPI. NBER defined recession dates shaded gray. Source: USDA, NBER, and author’s calculations.
If the Administration should go through with withdrawal from NAFTA, prices should decline further as Mexican and Canadian barriers against US agricultural exports rise. If China should retaliate against U.S. agricultural exports in response to recent (solar panels, washing machines) and incipient protectionist measures, then prices and quantities will be further pressured.
This takes place in a context wherein, despite a weakening dollar, real exports of food, feed and beverages have decreased.
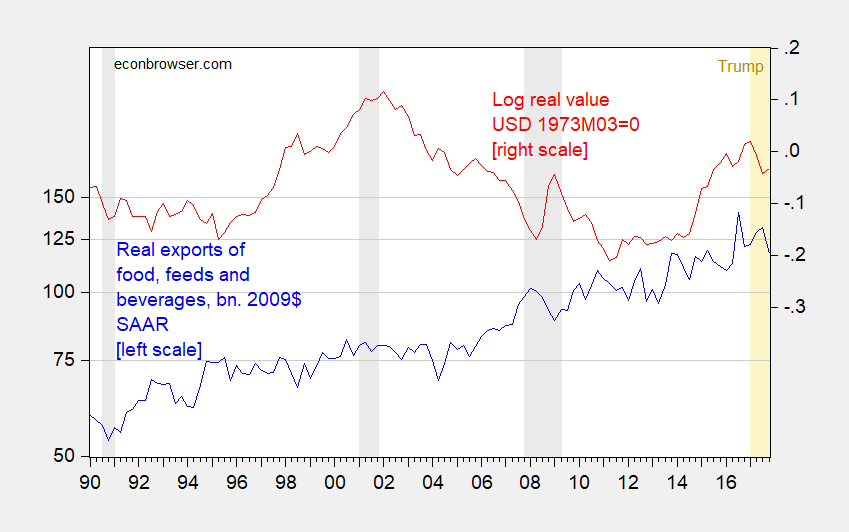
Figure 3: Exports of food, feeds, and beverages in bn. Ch.2009$ SAAR (blue, left scale), and log real value of US dollar against broad basket of currencies, 1973M03=0 (red, right scale). Gray shading denotes NBER defined recession dates. Orange shading denotes Trump administration. Source: BEA 2017Q4 advance release, December trade release, Federal Reserve via FRED, and author’s calculations.
Food exports are down 3.1% year-on-year.
Oh. And the President’s budget proposed reducing agricultural commodity subsidies by $28.8 billion (over ten years).


Leave A Comment