Reader Tim Wallace sent in another series of interesting charts showing the existing trends in employment, government spending, population, and labor force. Click on any chart for a sharper image.
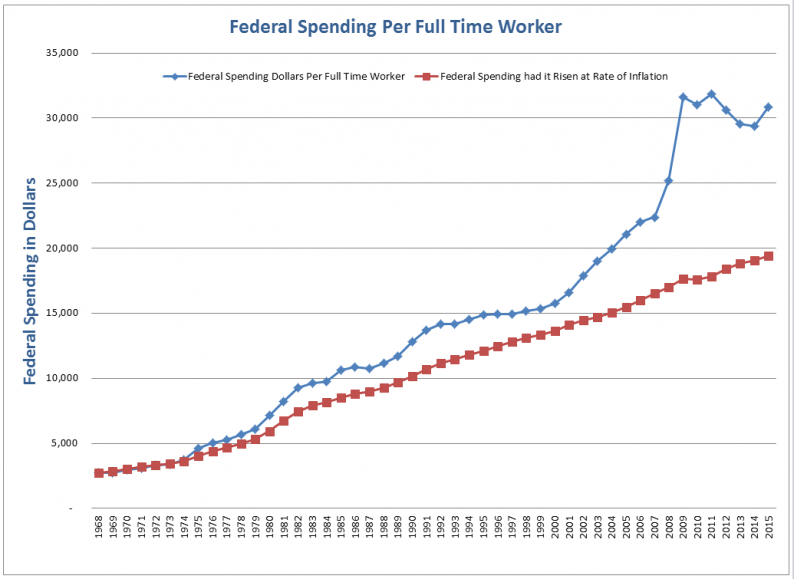
Federal Spending Per Full Time Worker

In 1968, the US government spent $2,734 per every full time worker. By 2015, the amount soared to $30,834. Had spending per full time worker increased at the rate of inflation, it would have been $19,390.
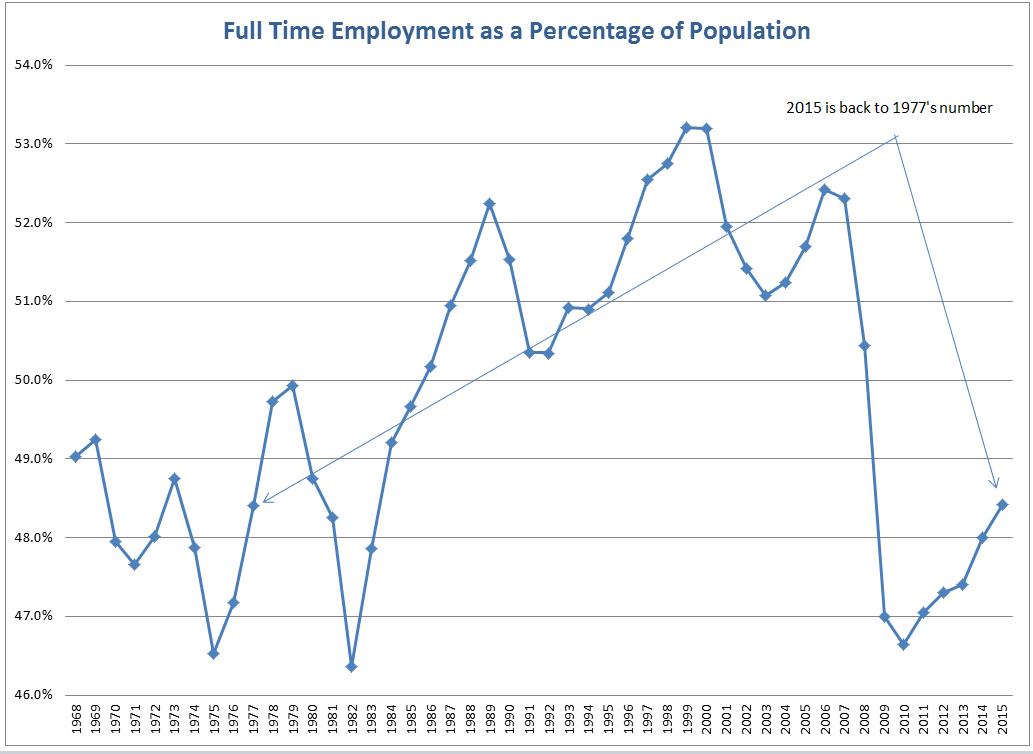
Full Time Employment as Percentage Population
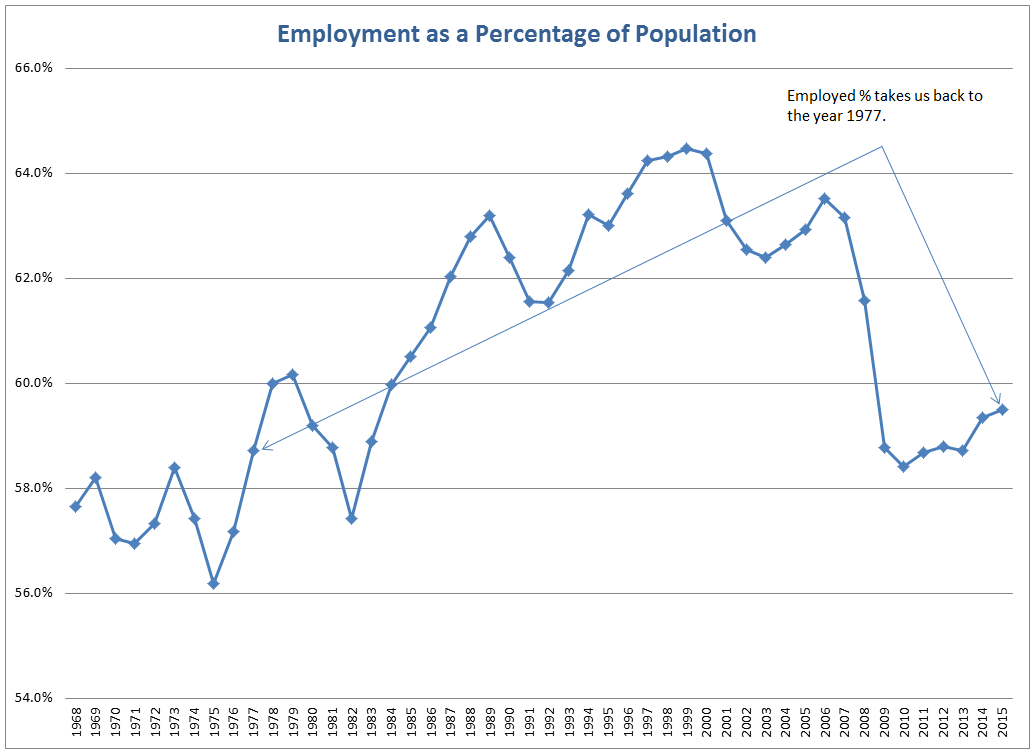
Employment as Percentage Population
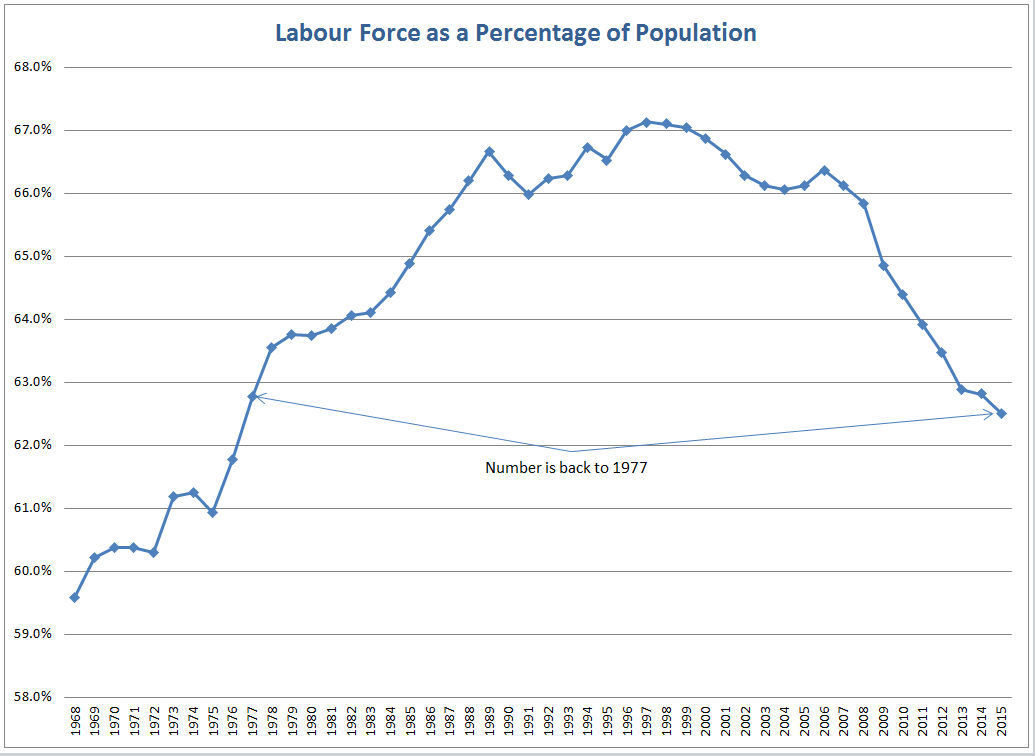
Labor Force as Percentage of Population
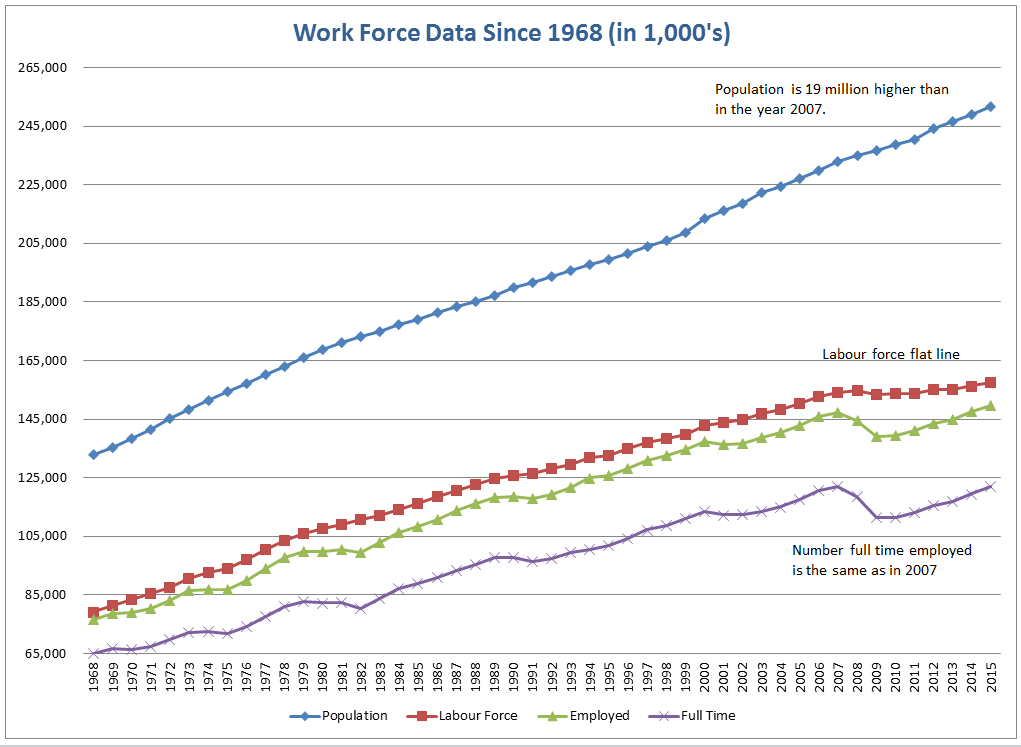
Work Force Data
Fewer and fewer workers are supporting more and more retires. Military spending, Medicare, Medicaid, and other entitlement costs have soared out of sight and not about to stop. In addition state pensions are a disaster area in spite of the massive stock market rally.
Millennials have now taken over as the largest demographic group, but they cannot possibly pick up all the associated costs. Something has to give.
Mike “Mish” Shedlock


Leave A Comment