
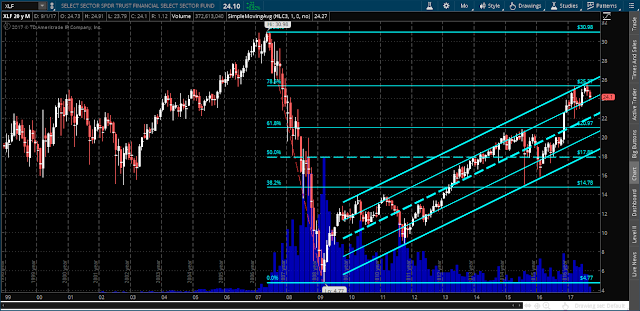
I last wrote about the Financial ETF (XLF) on July 11th. Since then, it failed to sustain a brief breakout above the 25.00 major resistance level, as shown on the following Monthly chart.
Price is sitting at the bottom of the upper quarter of a long-term uptrending channel…a segment that it hasn’t typically remained in for very long, or ventured above, since it began its long ascent from its 2009 lows after the financial crisis.
Major support sits around 20.00 (confluence of 60% Fib retracement and price level) and could be a downside target if price breaks and holds below near-term price support of 23.00, as shown on the following Daily chart. So far this year, downtrending RSI, MACD, PMO, and volumes have not provided the support needed for a sustained push higher.


Leave A Comment