
Fixed Investment – ECRI Leading Index Goes Negative
The ECRI leading index has been bearish on the American economy since late 2017.
Now that the stock market has had 2 corrections in 2018, ECRI can claim victory even though GDP growth has been strong in 2018.
It’s interesting to see media commentators and investors who have been bearish claiming victory on stocks as if the market is destined to go lower or at least stall out.
The market has been volatile lately, but most economic reports don’t suggest a recession is coming soon.
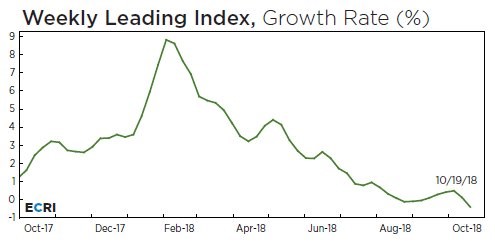
As you can see from the chart below, the ECRI leading index is now down 0.4% year over year.
If the index doesn’t spike, it will look even worse as the year progresses. Comparisons will get tougher. This index is a tool.
Tools are meant to be used, not followed mindlessly. I would find it interesting if this index shows sharply negative year over year growth. But I won’t be clamoring for a recession.
Fixed Investment – A Deeper Look At The Q3 GDP Report
As I mentioned previously, the GDP report was helped by inventory investment. And it was hurt by the trade data which is the opposite of Q2.
This was catalyzed by pre-buying of goods before the tariffs were implemented. Each round of tariffs catalyzes pre-buying.
It was easy to see that inventories were going to be built. And that export growth wasn’t going sustain that Q2 increase. Soybean exports exploded in Q2 and retracted in Q3. This impact didn’t change the fact that growth was very strong in Q2. And that Q3 growth was strong but weaker than Q2.
The chart below shows GDP growth without inventory and trade effects. Q3 growth fell to 3.1%. It’s interesting to see there haven’t been any negative growth quarters in this expansion without these factors.
Inventories are altered by supply and demand factors but don’t change long-term growth. It’s great to see strong export and import growth. However, tariffs make the data erratic.


Leave A Comment