
TM Editors Note: This article discusses a cryptocurrency. Such investments are by their nature high-risk and highly speculative. Do your own careful due diligence.
Dash (DASH-X) breaks out of a bullish pennant and subsequently pulls back to test the top trend line of the pattern and the 50-period moving average as support. Note that the 50 period line was an exact match with the trend line at the breakout point. So far it has held thereby providing a possible second entry zone in anticipation of further strengthening following the breakout.
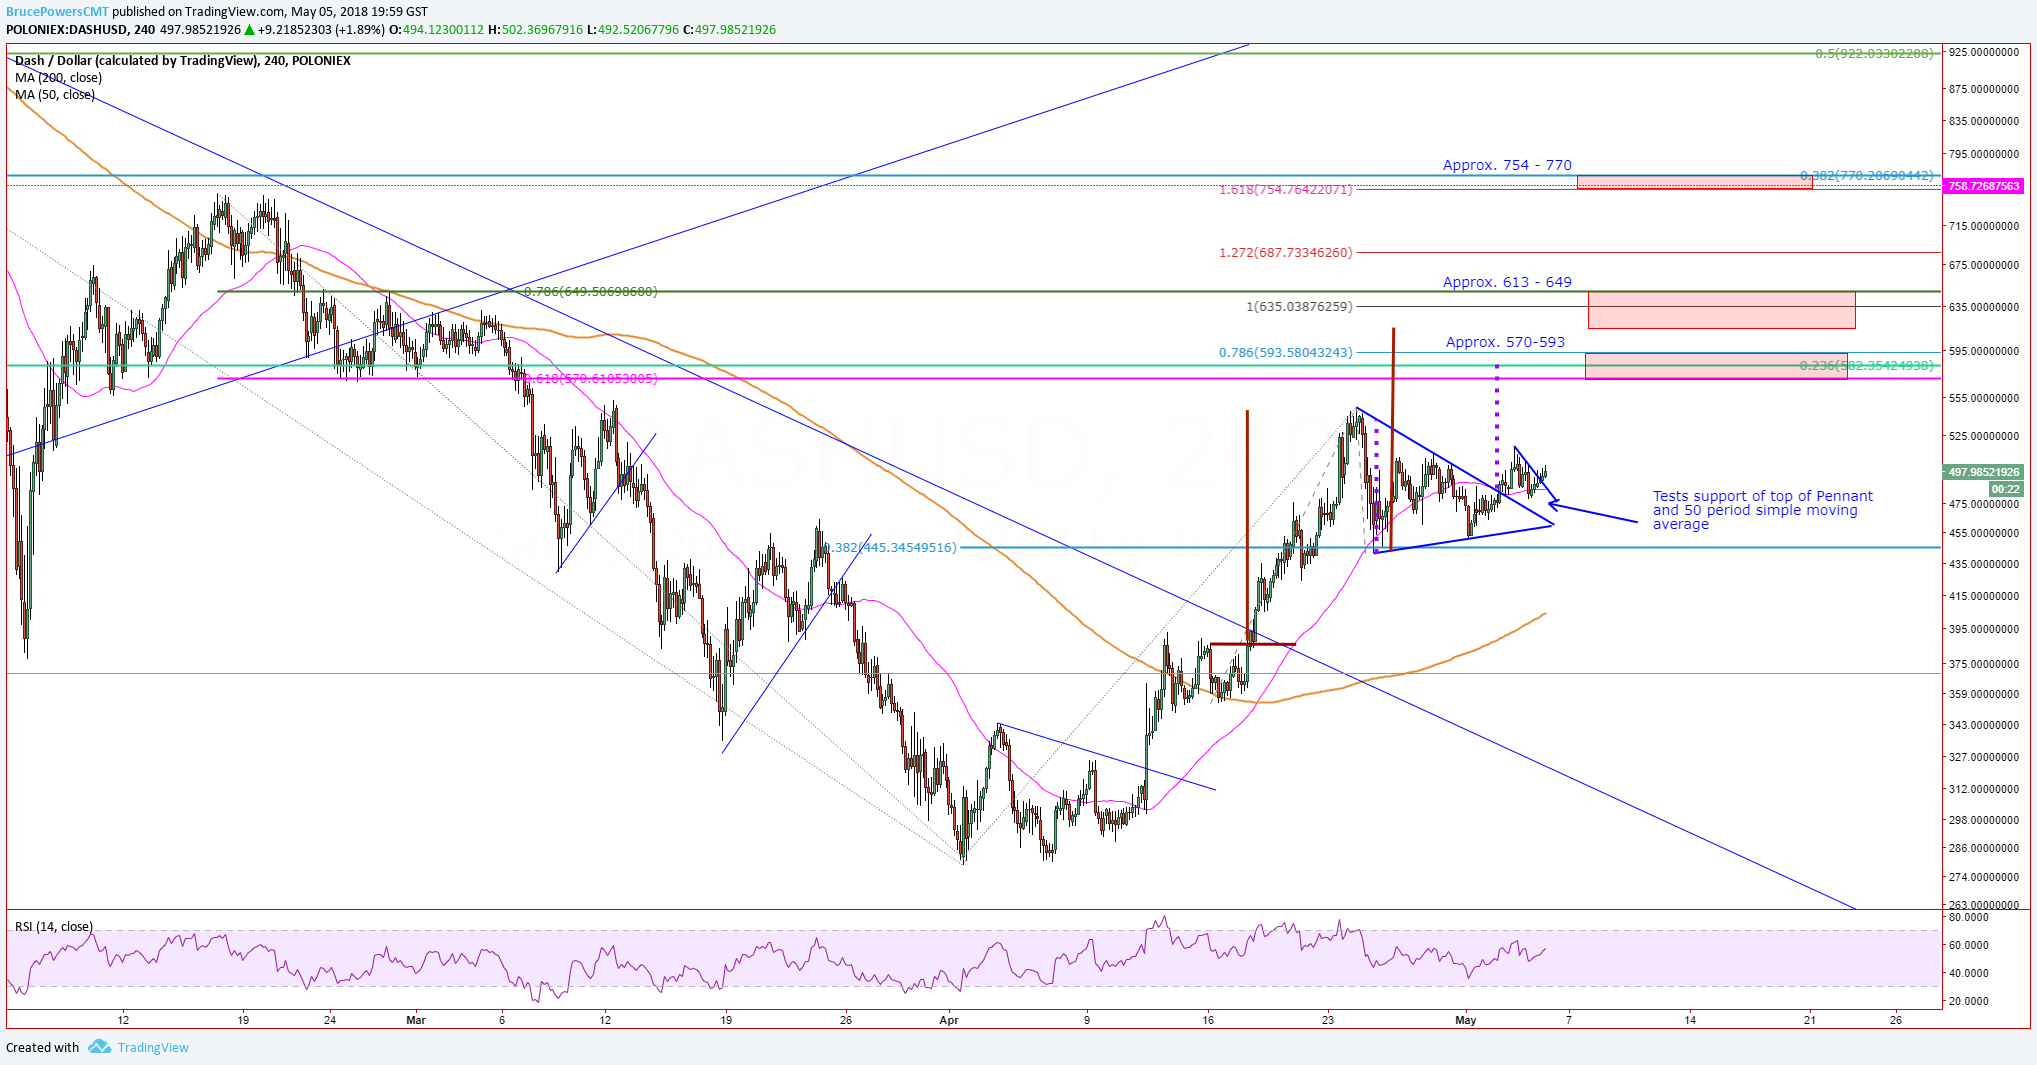
Further confirmation of strength is now needed. That first occurs on a move above the recent minor swing high of $516.93, and then on a rally above the more significant $547.27 peak (top of pennant). A rally above the higher price level confirms the breakout of the pennant and continuation of the uptrend. Until then it’s still possible that the pennant consolidation will evolve into a larger consolidation pattern.
Potential targets are highlighted in red in the accompanying 4-hour chart of Dash. Price levels are identified via a combination of Fibonacci levels from a variety measurements and the measuring objective of the symmetrical triangle pennant and then including the pole of the pennant. A conservative measurement is used for the pole.
The first target zone comes in around $570 to $593 and includes a target from the triangle at around $581.10. That potential resistance zone is followed by a large price zone from around $613 (pennant target) to $649, and then finally the third and higher target from $754 to $770, which includes the February peaks.
Initial Target Zones:
A drop below the bottom of the pennant around $450 would invalidate the bullish outlook discussed above.
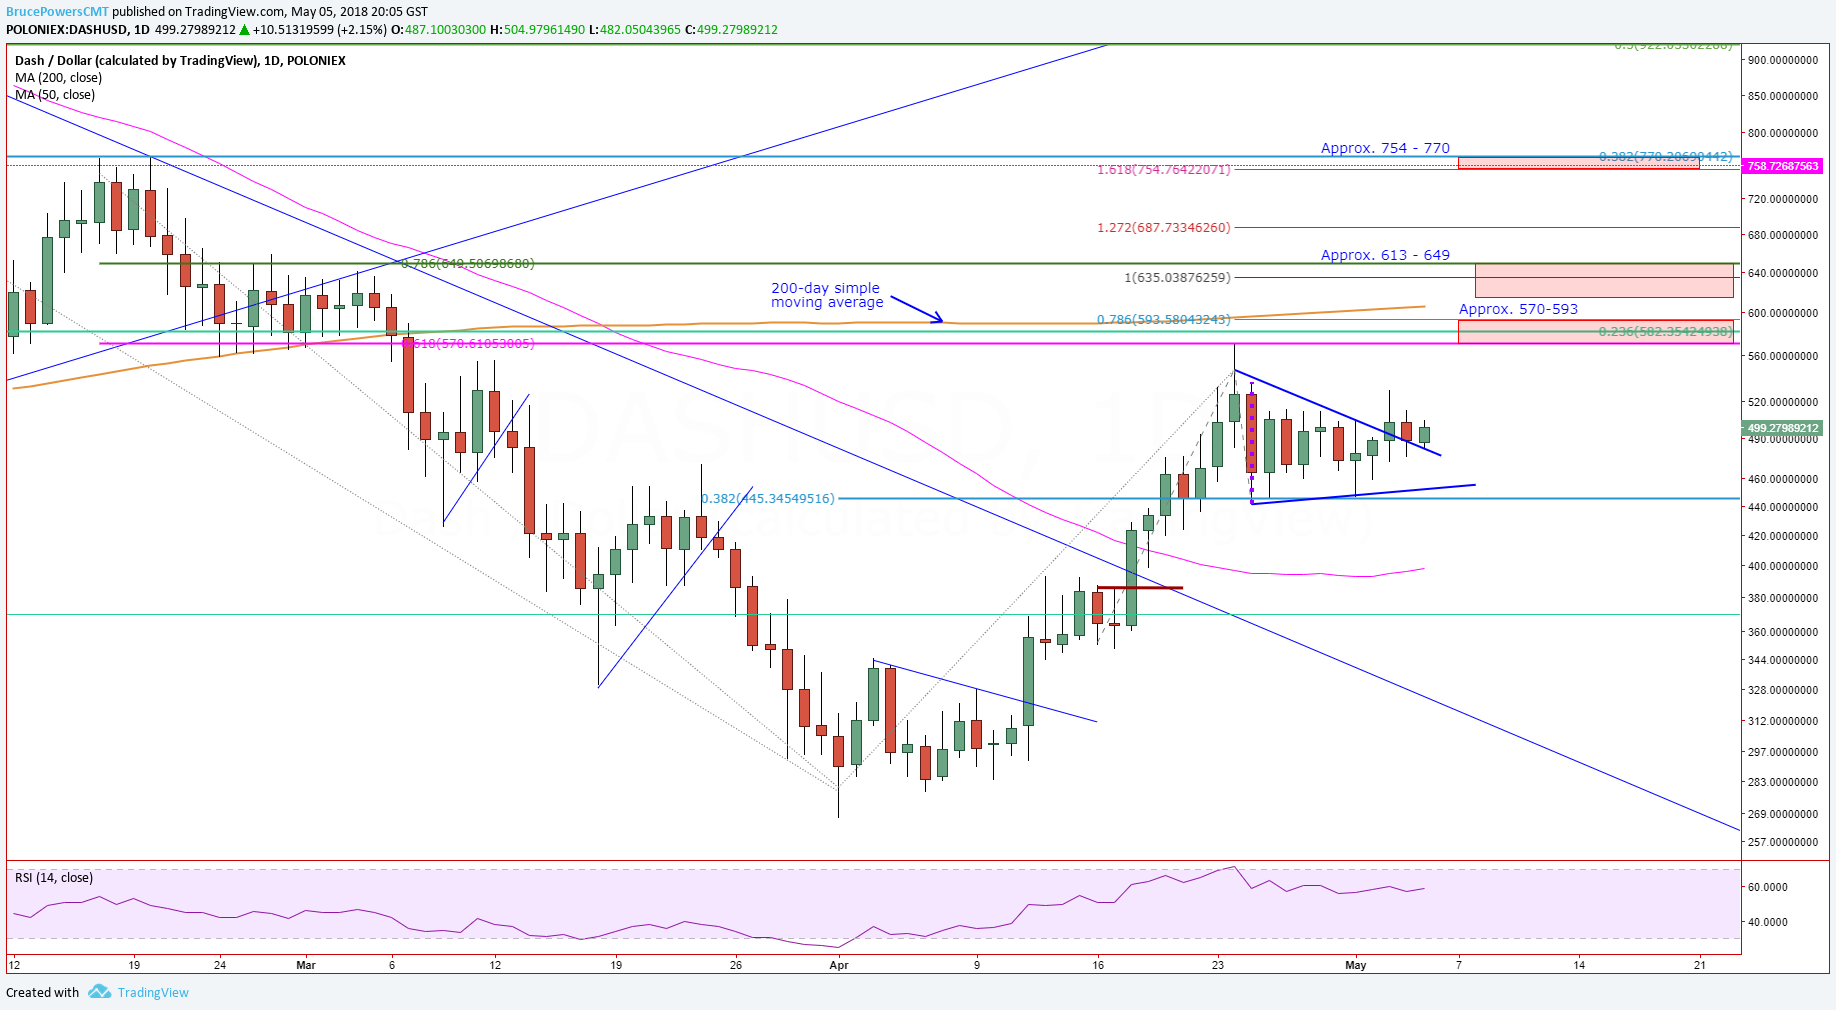
Also, note on the following daily chart of Dash that the 200-day simple moving average (brown line), currently at $605.76, is in between the first two price zone. This should be watched closely as well. Dash has been below its 200-day line since early March and a breakout above it would be an important bullish indicator for the intermediate and long-term.


Leave A Comment