
In the Currency Strength table, the EUR was the strongest currency again while the NZD was the weakest. There were some significant changes last month with the JPY gaining 3 points, the USD 2 points and the CHF losing 2 points. The other currencies remained around the same level of last month with a maximum change in the strength of just 1 point.
The USD showed a very strong performance at the end of the month. The EUR showed a steady and strong performance during the whole month and to a lesser extent, the CAD did too.
These currencies fit exactly with the current performance in the Classification and Score that they have.
The AUD showed a very weak performance at the end of the month. The NZD showed a very weak performance during the whole month and to a lesser extent, the CHF did too.
The CHF fits exactly with the current performance in the Classification and Score that it has.
The AUD and NZD are Neutral currency and do not fit exactly with the current performance in the Classification and Score that they have. However, being Neutral currencies it may offer some good opportunities against the Strong currencies.
Based on the development at the end of last month and the steady performance of the currencies during the last month as described above it seems that going long with the USD, EUR or CAD against the CHF, AUD and NZD may offer good opportunities. If this is being confirmed by the analysis in both of my Monthly articles and the charts are looking in the right direction, these combinations may offer good opportunities.
12 Months Currency Score Strength
The 12 Months Currency Strength and the 12 Months Average are provided here below. This data and the “12 months Currency Classification” are considered for deciding on the preferred range. Because it is not ideal nor desired to change the range for a currency every single month, we perform several checks to avoid this.
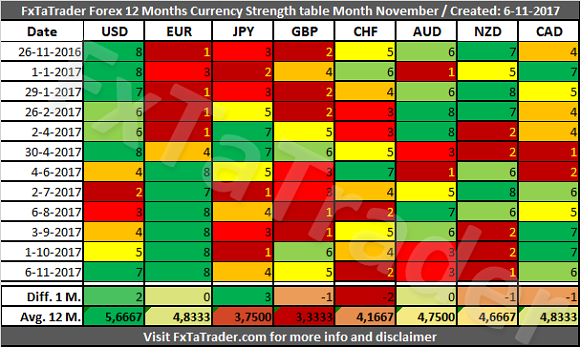
Average 12 M. Score
When looking at the Average 12 M.. Score we can see the currencies grouped together according to their classification.


Leave A Comment