
Friday’s end-of-week action didn’t generate a big splash, but it did give an inkling as to what might happen for the coming week when the sequence of loss, gain, loss was met with a failure of markets to hold on to Friday’s strong open.
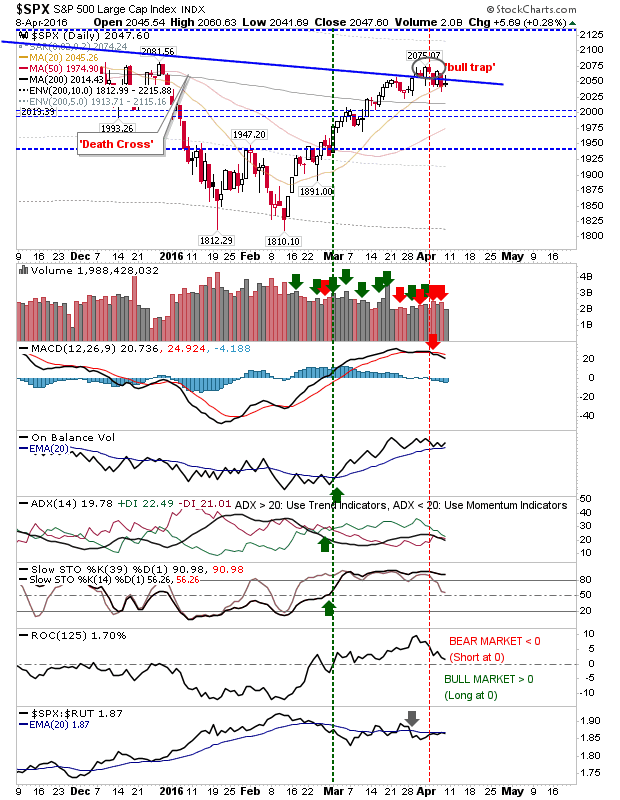
The S&P maintains the ‘bull trap’ with Friday’s low volume amplifying the weakness of Friday. Other technicals are holding on, but for how long.
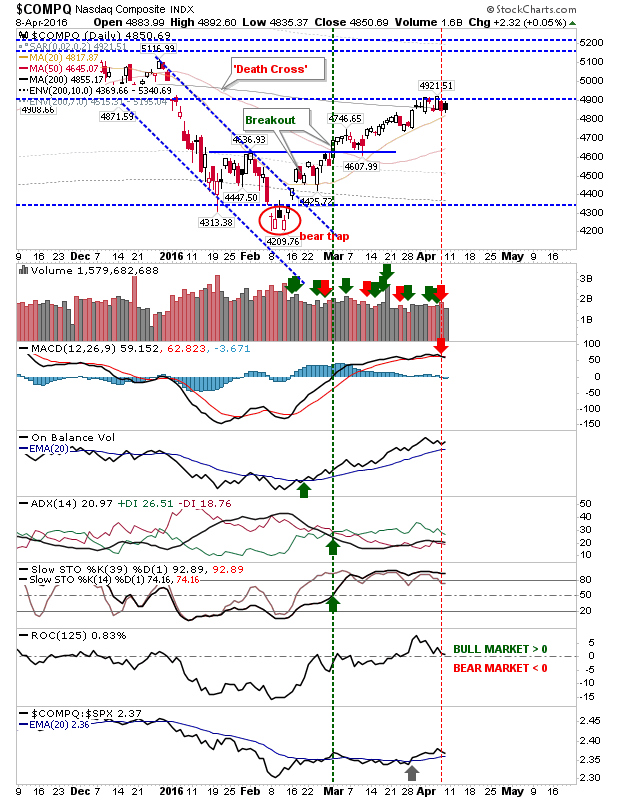
The Nasdaq finished with a bearish black candlestick, but retained support of its 200-day MA. It’s also pegged by 4,900 resistance, which was support at the end-of-2015, but has since proved it to be sticky resistance. The 20-day MA is also fast approaching; maybe this will be the kicker to get the index above 4,900? MACD holds to a ‘sell’ trigger.
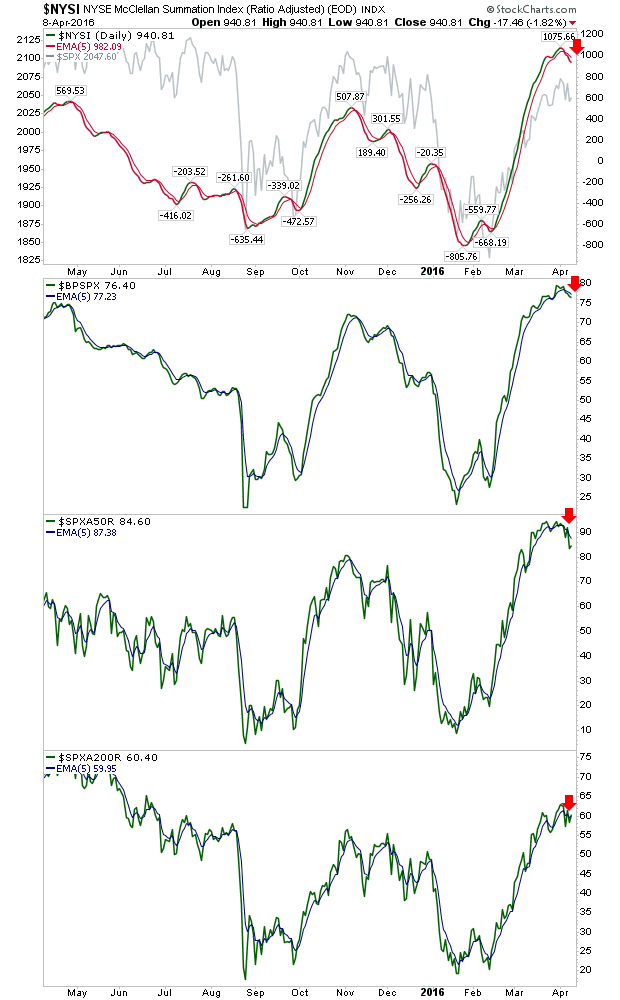
NYSE Breadth looks to have marked a top with a rollover from a new high (of extreme bullishness). However, given the fall from extreme bullish breadth, the next swing low could prove an attractive ‘buy’ the dip opportunity.
Nasdaq breadth – particularly the percentage of stocks above the 50-day MA – is looking a little rich. This in the context of an index which still has room to go to make a new high; suggesting this advance will not be one to do it if new all-time highs are to happen.
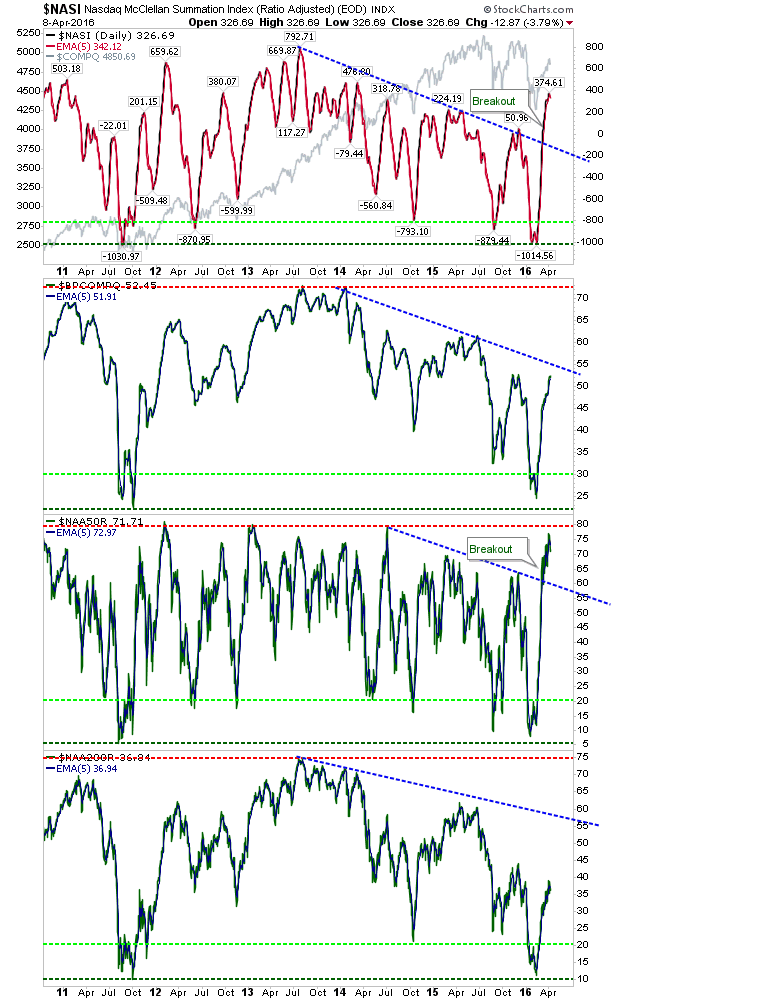
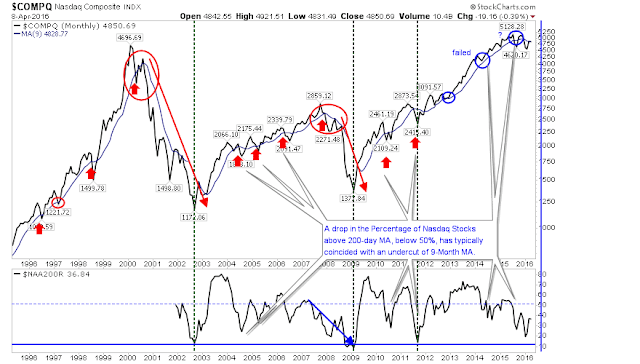
The Nasdaq monthly chart is also pointing to a top with plenty of room before the percentage of stocks above the 200-day MA is oversold enough to suggest a long term bottom.
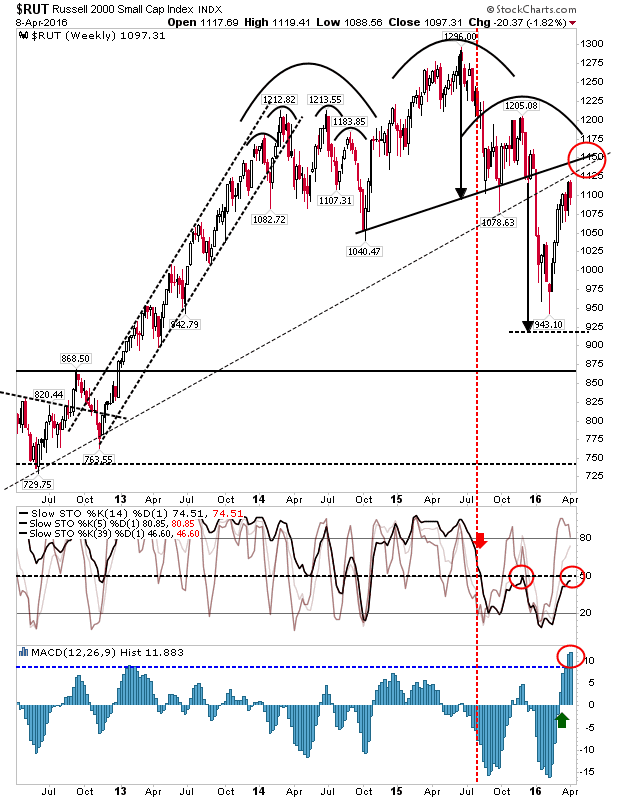
Finally, the Russell 2000 is also playing close to a possible inflection point. The rally is getting close to converged resistance which would mark a confirmation of a reversal head-and-shoulder pattern. Stochastics have remained in the bearish camp throughout the rally from 943 lows, while the MACD histogram is heavily overbought.
For the coming week, watch for a sell off to create the next swing low. The volume which accompanies the fall will give an indication as to whether the downleg will be a temporary fall, or something with more merit for shorts/bears.


Leave A Comment