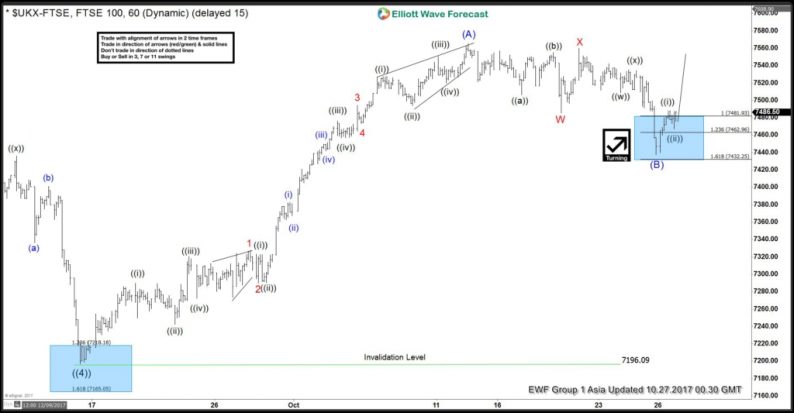
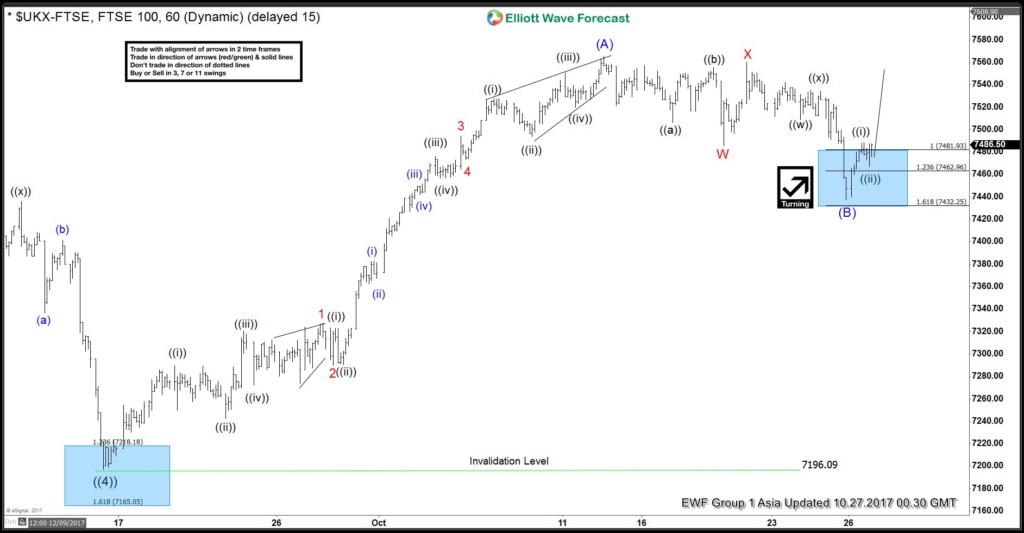
FTSE Elliott Wave view suggests that decline to 7199.5 ended Primary wave ((4)). Up from there, the rally is unfolding as an impulse Elliott Wave structure where Minor wave 1 ended at 7327.5 and pullback to 7289.75 ended Minor wave 2. Rally to 7494.34 ended Minor wave 3, and pullback to 7473.12 ended Minor wave 4. Minor wave 5 ended at 7565.11 and this also ended Intermediate wave (A) of a zigzag Elliott Wave structure from 9/15 low (7199.5).
Intermediate wave (B) pullback unfolded as a double three Elliott Wave structure where Minor wave W of (B) ended at 7485.42, Minor wave X of (B) ended at 7560.04 and Minor wave Y of (B) ended at 7437.42. Near-term, while pullbacks stay above 7347.42, and more importantly as far as pivot at 9/15 low (7196.09) stays intact, expect Index to extend higher. We don’t like selling the Index.
FTSE 1 Hour Elliott Wave Analysis
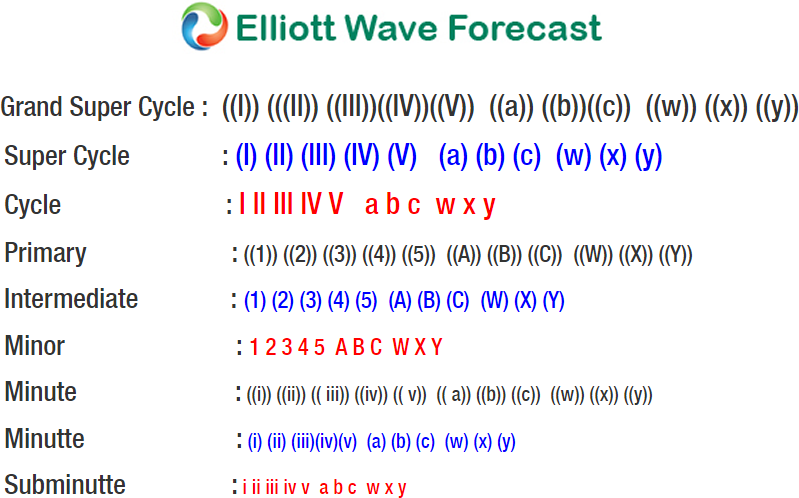
Zigzag is a 3 waves corrective pattern which is labeled as ABC. The subdivision of wave A is in 5 waves, either as impulse or diagonal. The subdivision of wave B can be any corrective structure. Finally, the subdivision of wave C is also in 5 waves, either as impulse or diagonal. Thus, zigzag has a 5-3-5 structure. Wave C typically ends at 100% – 123.6% of wave A.


Leave A Comment