
The front month WTI futures contract traded as low as $27.27 this morning, a few dimes less than the low of January 20. Just three months out, however, the June 2016 contract is trading at $33.17 and up $0.43 on the day (as of this writing). Just two months further to August, that futures price is $35.11, up $0.53 on the day. That’s about $8 contango just in the five months. This sharp “hook” downward in the oil curve is the signal of liquidation, and unorderly at that.
Trading earlier this week certainly reflected that up and down asset markets, as liquidity strains were evident in widespread fashion. The effect in oil has been devastating, however, as those optimists still suggesting this is all about “supply” are finding the liquidations “winning” the curve battle. In other words, basic economics suggests that demand should rise at lower prices, even with the “friction” of supply, but the persisting liquidations and the cumulative effect has only been lower and lower. The oil curve, like money curves everywhere, is prisoner of a dark economic future.
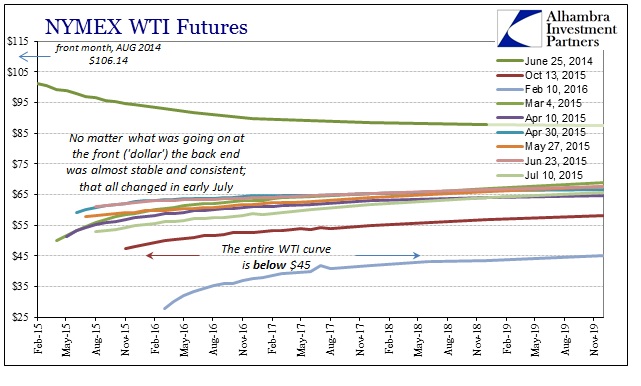
For much of last year, the idea of “transitory” was at least plausible for the longer maturities. After the first wave of the “dollar” and related oil crash, the WTI curve attained an almost simplistic consistency in that respect. As you can see above, from March until early July, no matter what was going on up front, the back end (later 2017 and out) remained largely undisturbed. The fact that this curve dynamic changed in early July is highly significant, representing the renewal of the latest “dollar” driven liquidations (run).
Whereas in the last Golden Week in China the WTI curve was relatively recognizable to those earlier 2015 conditions, with the whole curve above $45, it has since been pushed and squashed by the full weight of “dollar” and recessionary fears so that now the whole curve is under $45, front to back!


Leave A Comment