
The GBP/JPY retreats deeper below the 190.00 figure after hitting a 9-year high of 193.55, as buyers fail to push through the latter and aim toward the 194.00 mark. At the time of writing, the pair traded at 190.69, down 0.61%. GBP/JPY Price Analysis: Technical outlookDespite falling, the GBP/JPY remains upward biased despite posting losses. The confluence of the Tenkan and Kijun-Sen at 190.75 capped the pair’s slide, but downside risks remain. If sellers push the exchange rate below the latter, the pair could aim for 190.00. Further losses are seen below that level, as the 189.00 psychological figure would be up next.However, the path of least resistance is upwards, and if they reclaim the 191.00 figure, look for further gains. The next resistance would be today’s high at 192.23, followed by the 193.00 mark. GBP/JPY Price Action – Daily Chart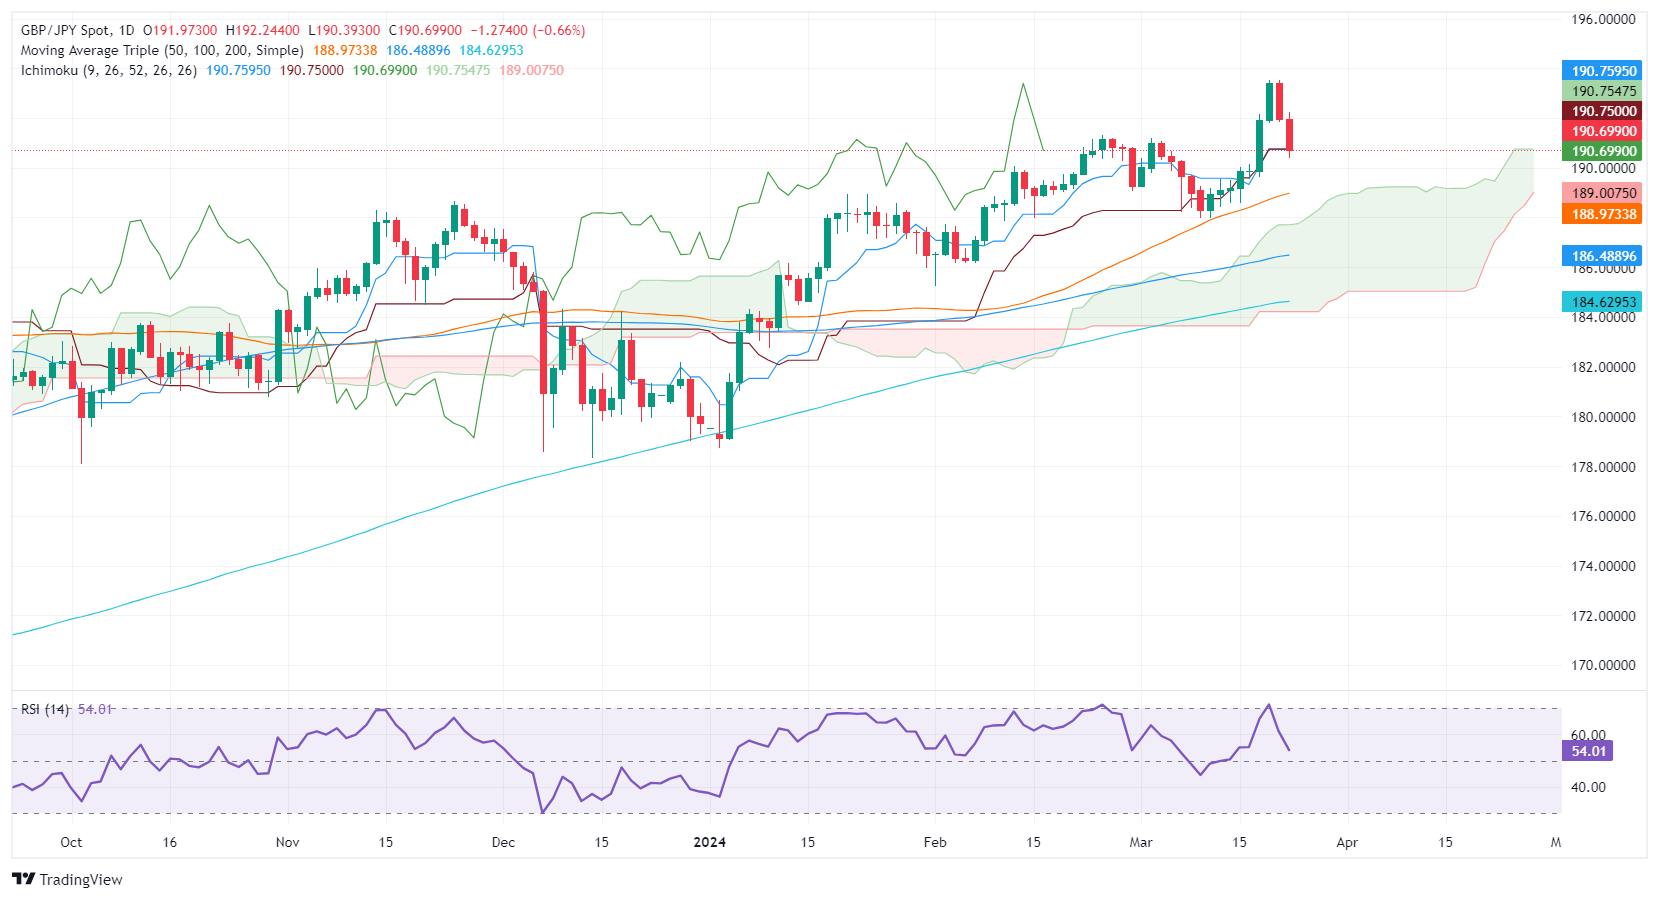 GBP/JPY
More By This Author:Silver Price Analysis: XAG/USD Tumbles As Bearish Engulfing Pattern Looms AUD/USD Climbs After Fed’s Decision, Ahead Of Aussie’s Job Data AUD/USD Stays Steady As Traders Digest RBA Decision, Eyes On Fed Meeting


Leave A Comment