GBPUSD
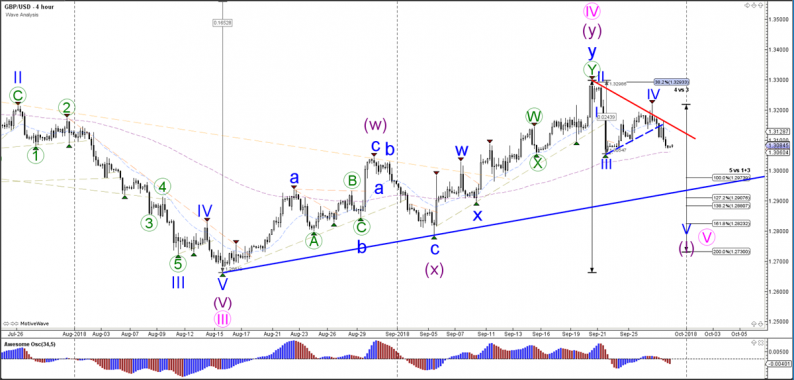
4 hour

Source: Admiral Markets MT5 with MT5 GBPUSD motive wave – Accessed: 28 September 2018 at 6:00 AM GMT
The GBP/USD currency pair broke below the support trend line (dotted blue) which seems to indicate the end of the wave 4 (blue) and the start of the wave 5 (blue). A bearish 5 wave (blue) pattern could complete a wave 1 (purple), which in turn is probably part of a larger wave 5 (pink). A break below the support trend line (blue) could confirm a downtrend continuation.
1 hour
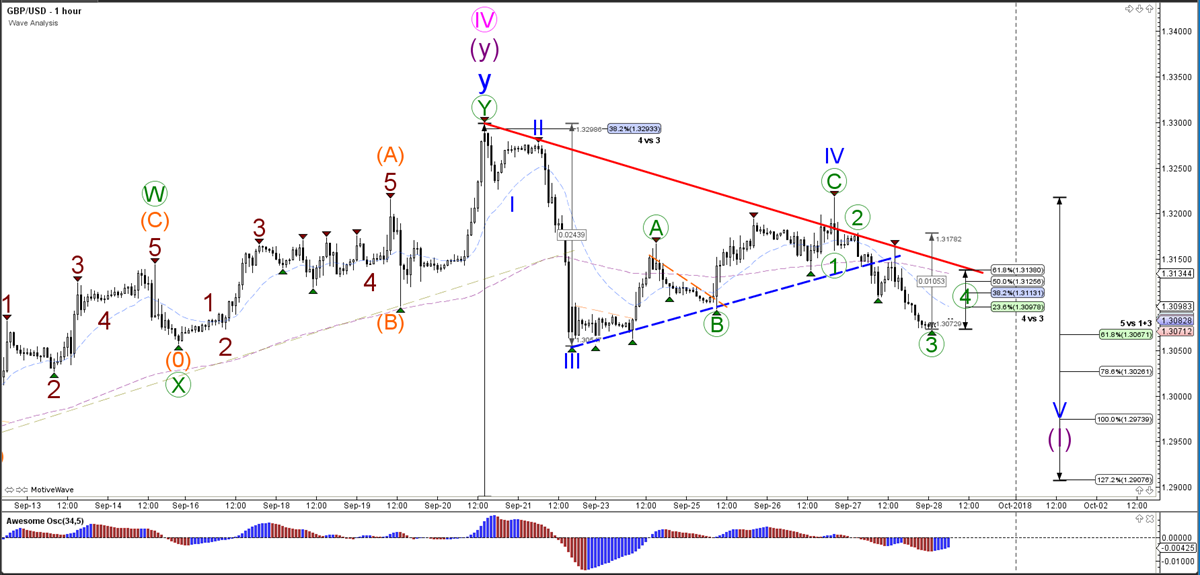
Source: Admiral Markets MT5 with MT5 GBPUSD motive wave – Accessed: 28 September 2018 at 6:00 AM GMT
The GBP/USD currency pair seems to be building a 5 wave (green) pattern within wave 5 (blue). The price is currently in a wave 3 (green) most likely. A retracement could be part of a wave 4 (green), as long as the price stays below the 50-61.8% Fibonacci levels. The main target could be around the round level of 1.30.
Daily
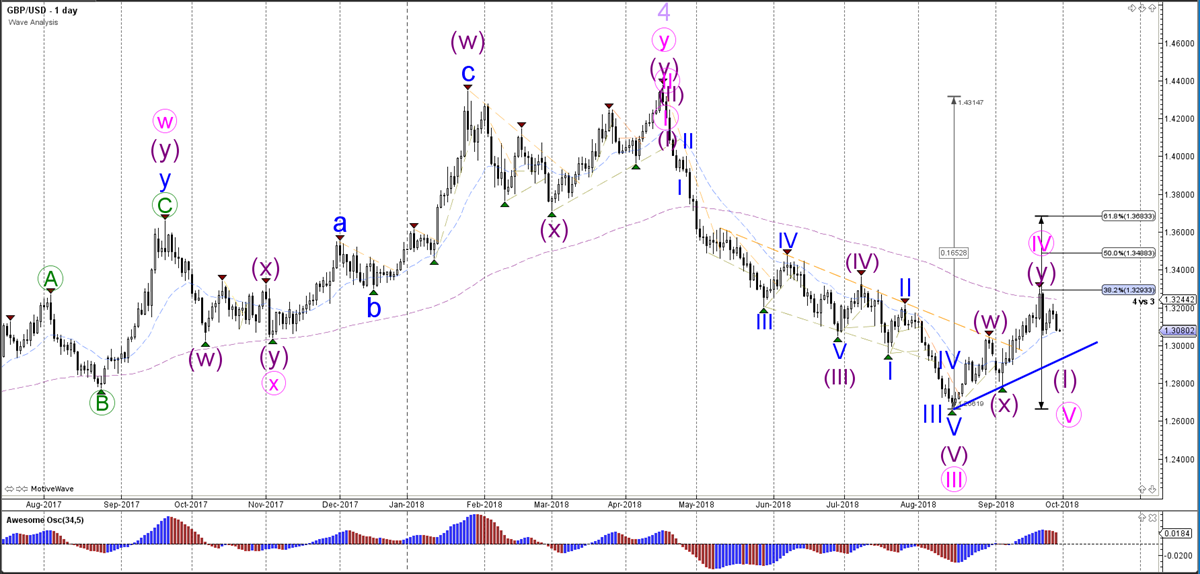
Source: Admiral Markets MT5 with MT5 GBP/USD motive wave – Accessed: 28 September 2018 at 6:00 AM GMT
The GBP/USD currency pair showed a strong bearish candle yesterday. The bounce at the 38.2% Fibonacci level could indicate the end of the wave 4 (pink), but the price must break the support trend line (blue) to confirm this wave pattern.


Leave A Comment