GBP/USD
4 hour

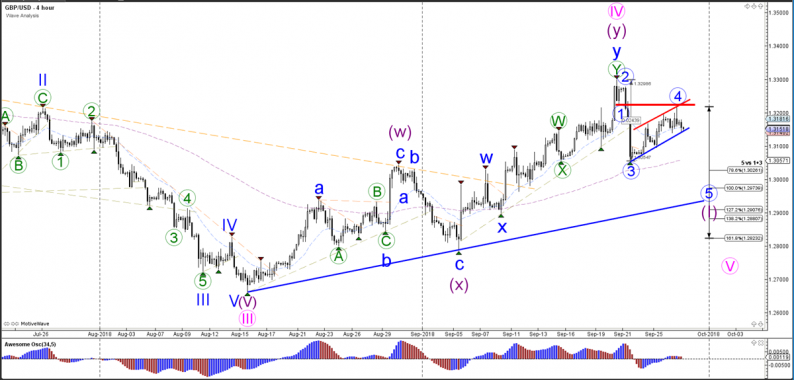
Source: Admiral Markets MT5 with MT5 GBP/USD motive wave – Accessed: 27 September 2018 at 6:00 AM GMT
The GBPUSD currency pair is building a potential bear flag chart pattern, which could be part of a wave 4 (blue) pattern as long as the price does not break above the bottom of wave 1, which is indicated by the red trend line. A break below the support (blue) of the bear flag could indicate a continuation towards the Fibonacci targets.
1 hour

Source: Admiral Markets MT5 with MT5 GBP/USD motive wave – Accessed: 27 September 2018 at 6:00 AM GMT
The GBPUSD currency pair could have made an ABC (green) pattern within wave 4 (blue), but the confirmation of that occurs when the price breaks through the support line (blue). A break above the resistance invalidates this wave pattern.
Daily

Source: Admiral Markets MT5 with MT5 GBP/USD motive wave – Accessed: 27 September 2018 at 6:00 AM GMT
The GBPUSD currency pair made a bearish bounce at the 38.2% Fibonacci level when reviewing the daily chart. The price needs to break the support trend line (blue) before the completion of wave 4 (pink), and the start of wave 5 (pink) becomes more likely.


Leave A Comment