
Earlier today, the British pound extended losses against the greenback, which pushed GBP/USD to a fresh multi-month low. How low could the exchange rate go in the coming days?
EUR/USD
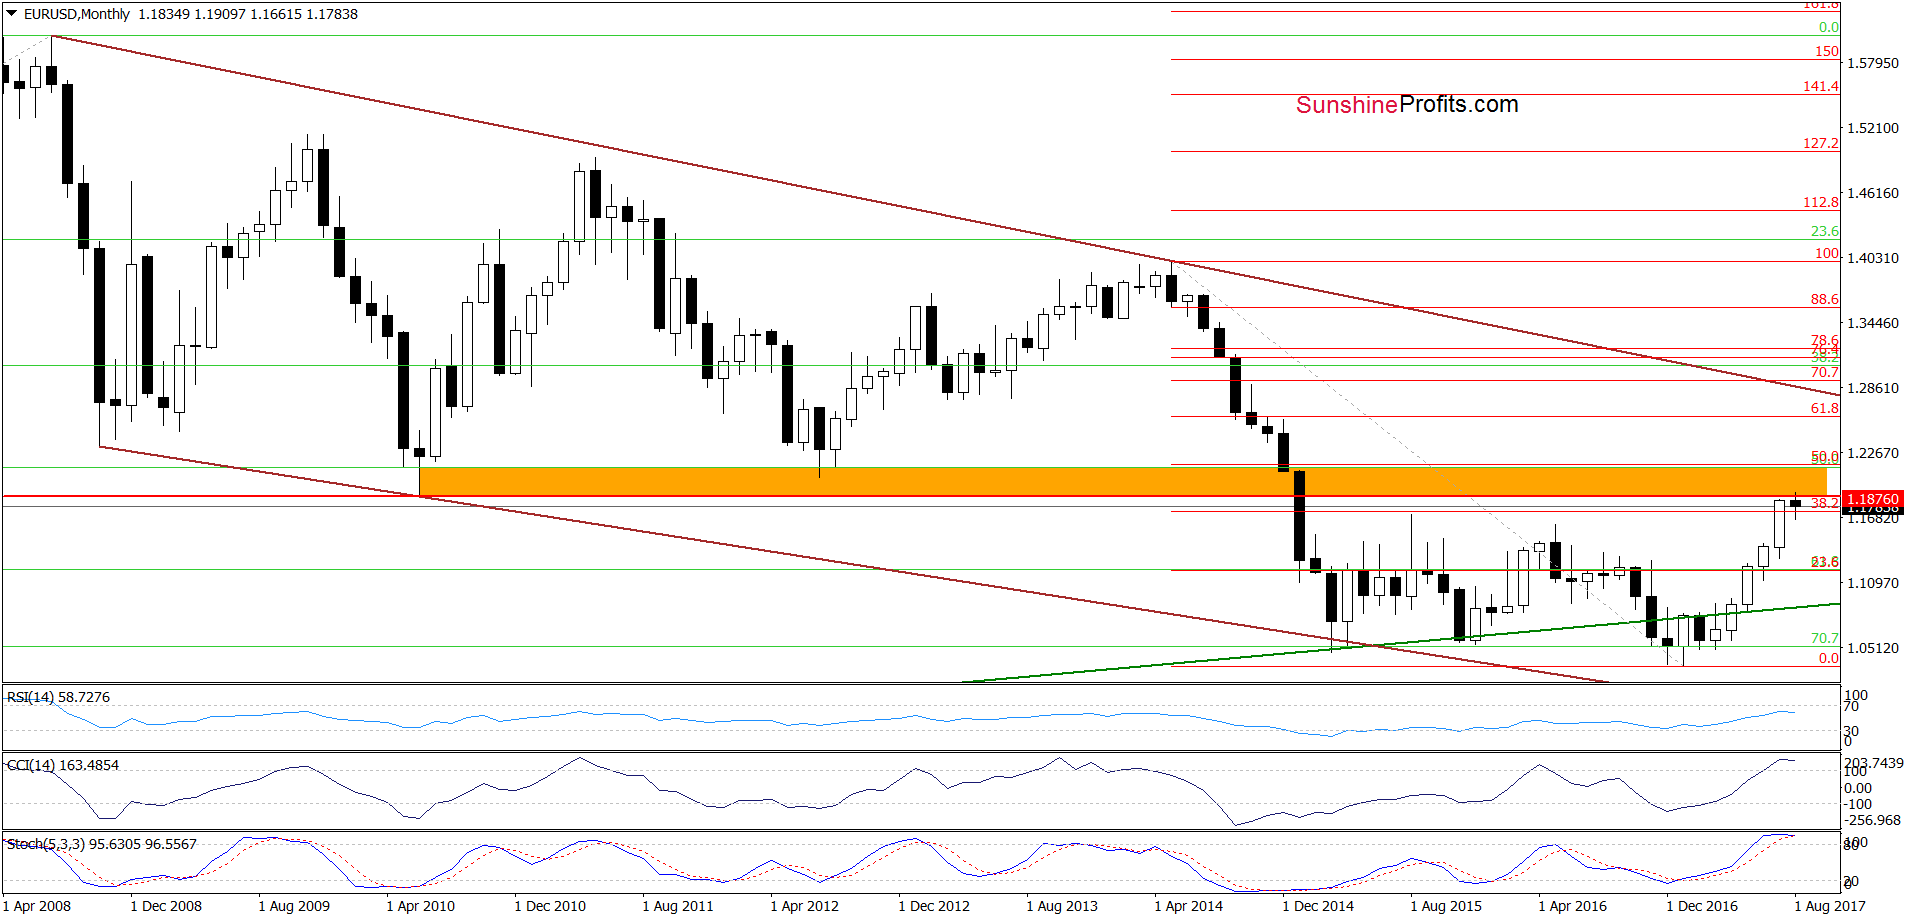

Looking at the charts, we see that although EUR/USD moved a bit lower, the exchange rate is still trading around 38.2% Fibonacci retracement and the 112.8% Fibonacci extension. Nevertheless, the pair closed the previous week above the retracement and invalidated the earlier tiny breakdown under this support. Earlier this month, we saw a similar situation, which suggests that one more upswing and a re-test of the recent highs can’t be ruled out in the coming days.
Very short-term outlook: mixed
Short-term outlook: mixed
MT outlook: mixed
LT outlook: mixed
GBP/USD

On Wednesday, we wrote the following:
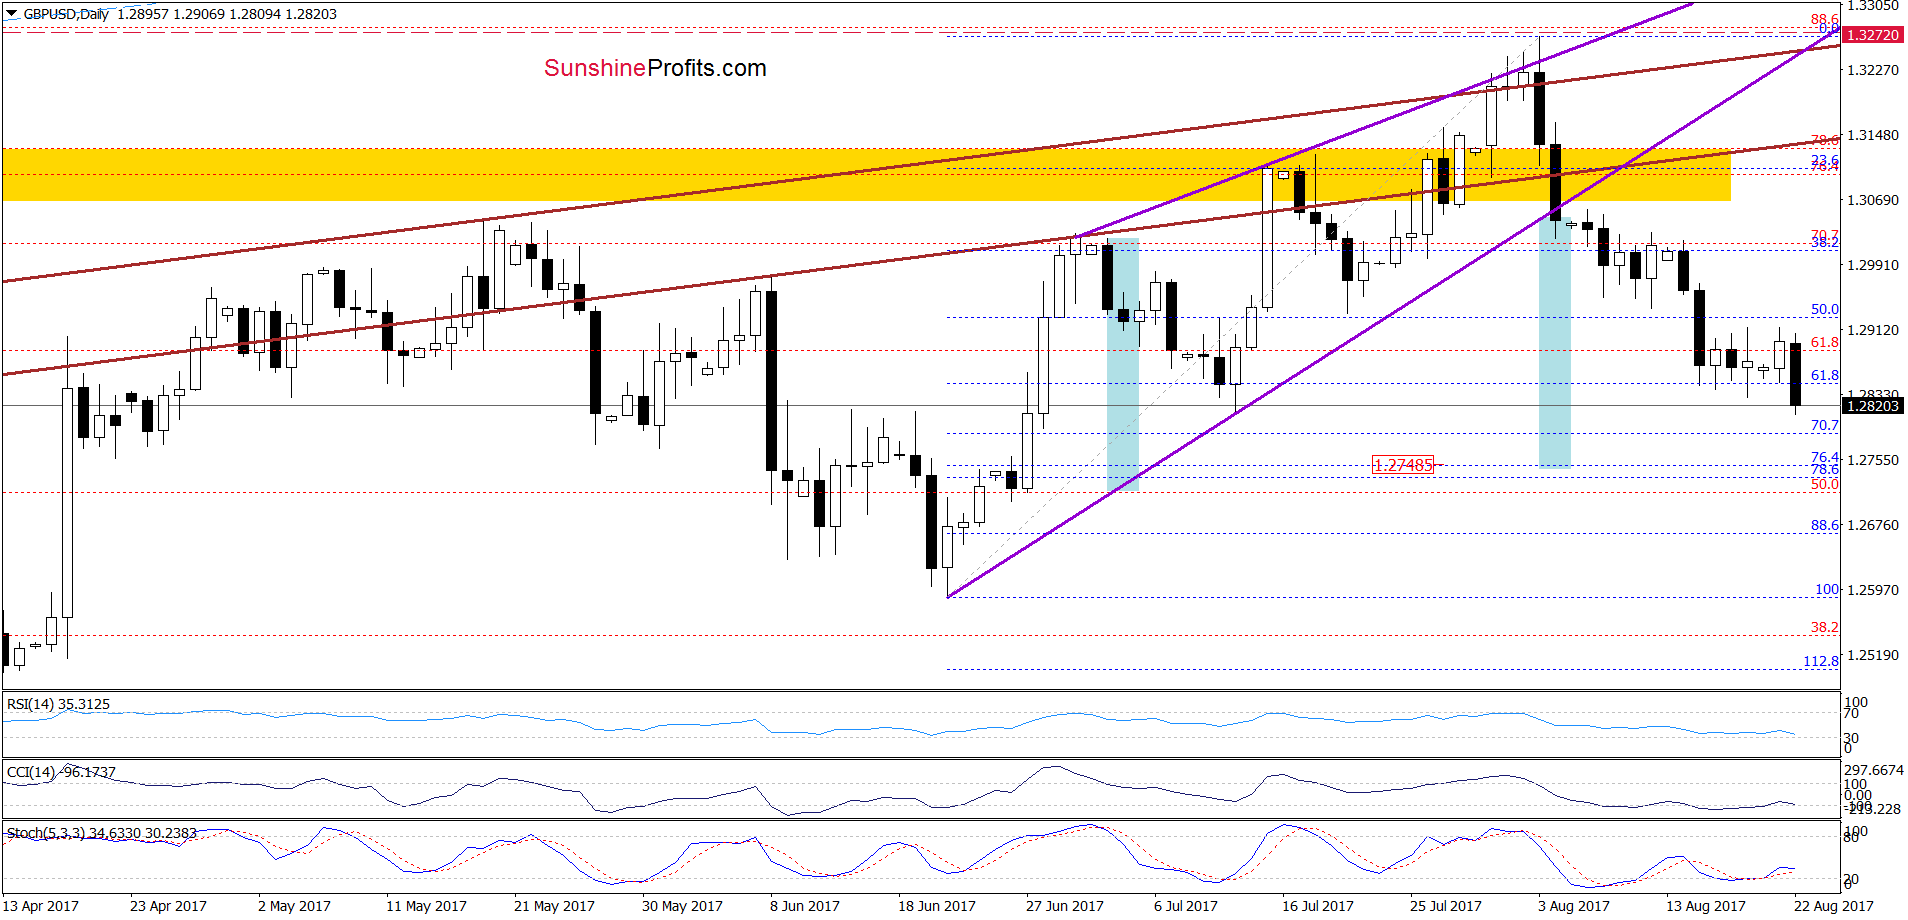
(…) GBP/USD slipped to the lower border of the brown rising trend channel, which could encourage currency bulls to act.
But will we see such price action? In our opinion, it’s quite doubtful, because even if the exchange rate rebounds slightly from current levels, we should keep in mind all bearish technical factors. Firstly, the sell signals generated by the weekly indicators remain in place, supporting currency bears and further declines. Secondly, when we take a closer look at the daily chart (…), we see that the sell signals generated by the daily indicators also support lower values of GBP/USD.
Thirdly, the pair moved sharply lower (…) and broke below the 50% Fibonacci retracement yesterday, which resulted in a slip slightly below the 61.8% retracement. Fourthly, GBP/USD remains well below the yellow resistance zone and the lower border of the purple rising wedge. All the above-mentioned negative factors increase the probability that we’ll see a realization of the bearish scenario (…)


Leave A Comment