HIGHLIGHTS
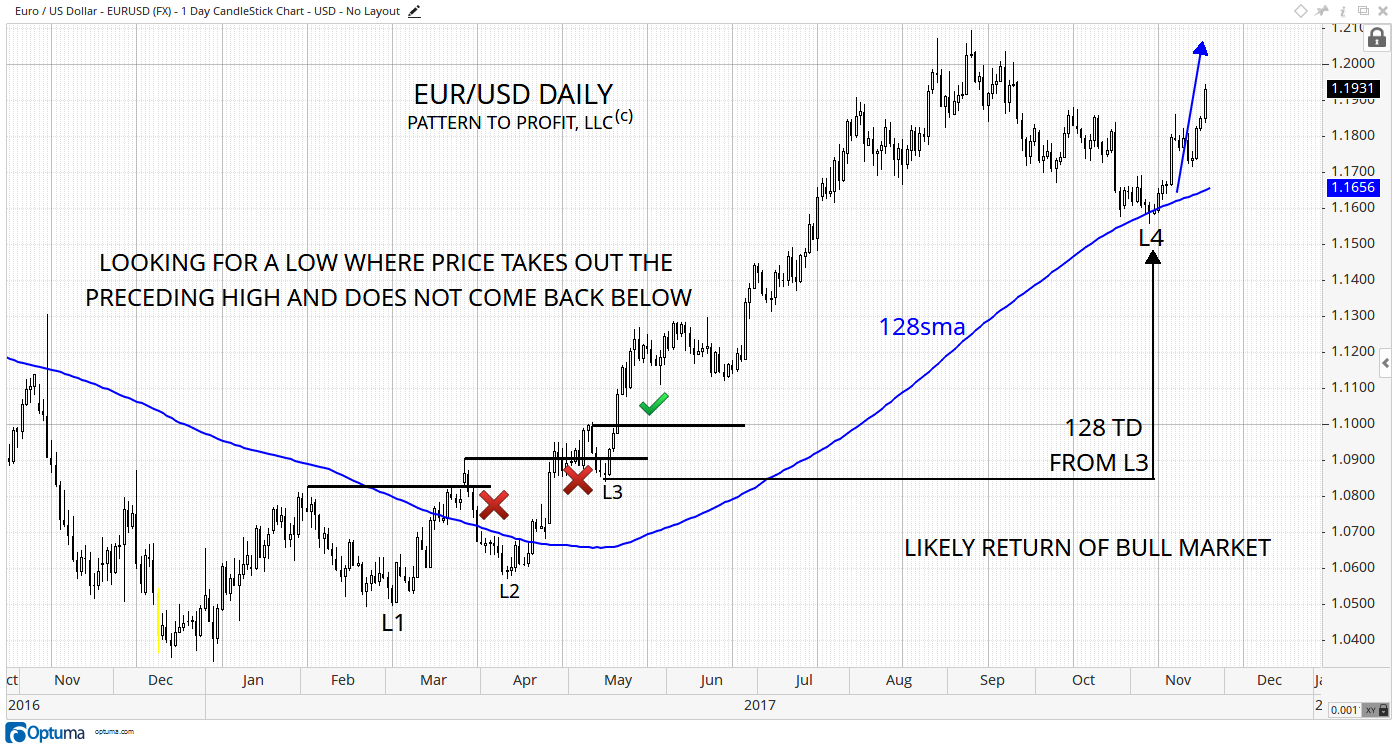
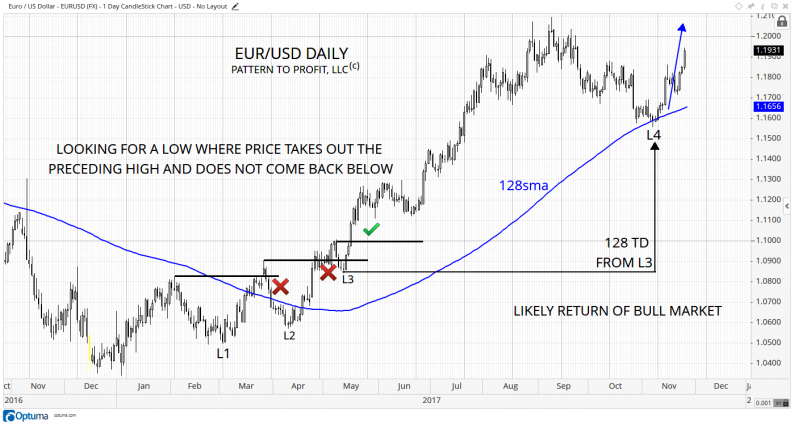
The Euro (EUR/USD) reversed its decline on Tuesday, Nov. 7 (marked L4) with a closing price of 1.1586. This close was sitting right on the average closing prices from the day before all the way back to the important low of May 11, 2017 at 1.0839 (marked L3).
There are many effective applications of a simple moving average (sma). However, a most overlooked and strikingly accurate application is to use a specific time value derived from an important high or low, to immediately calculate the cumulative average price for the period in question as is done on the following EUR/USD charts.
In the first chart, the Euro daily can clearly be seen bouncing right off one such average, a 128-simple moving average (offset by +1). Its price value for that low on November 7th represented the average closing prices since L3, exactly 128 trading days prior. The 128sma is still useful for support, as it represents that entire distance in time (from L3 to L4) moving forward in time.
Why the low at L3? Notice that for uptrends from L1 & L2, the market rose above resistance from the preceding high (black horizontal), then rather promptly broke back down and closed below (red X’s). However, the uptrend from L3 stayed above its respective resistance (green check), establishing the importance of that low.
Although the recent bounce seems impressive, confirmation of a resuming uptrend is offered by the market breaking above the resistance level of 1.18005. This price level is also derived by using the November 7 low, but this time combining it with the major high 42 trading days prior, along with a 42sma (red). 1.1805 is the value of that 42sma for November 7. The ‘square point’ is shown with a right angle (90o) of red lines:
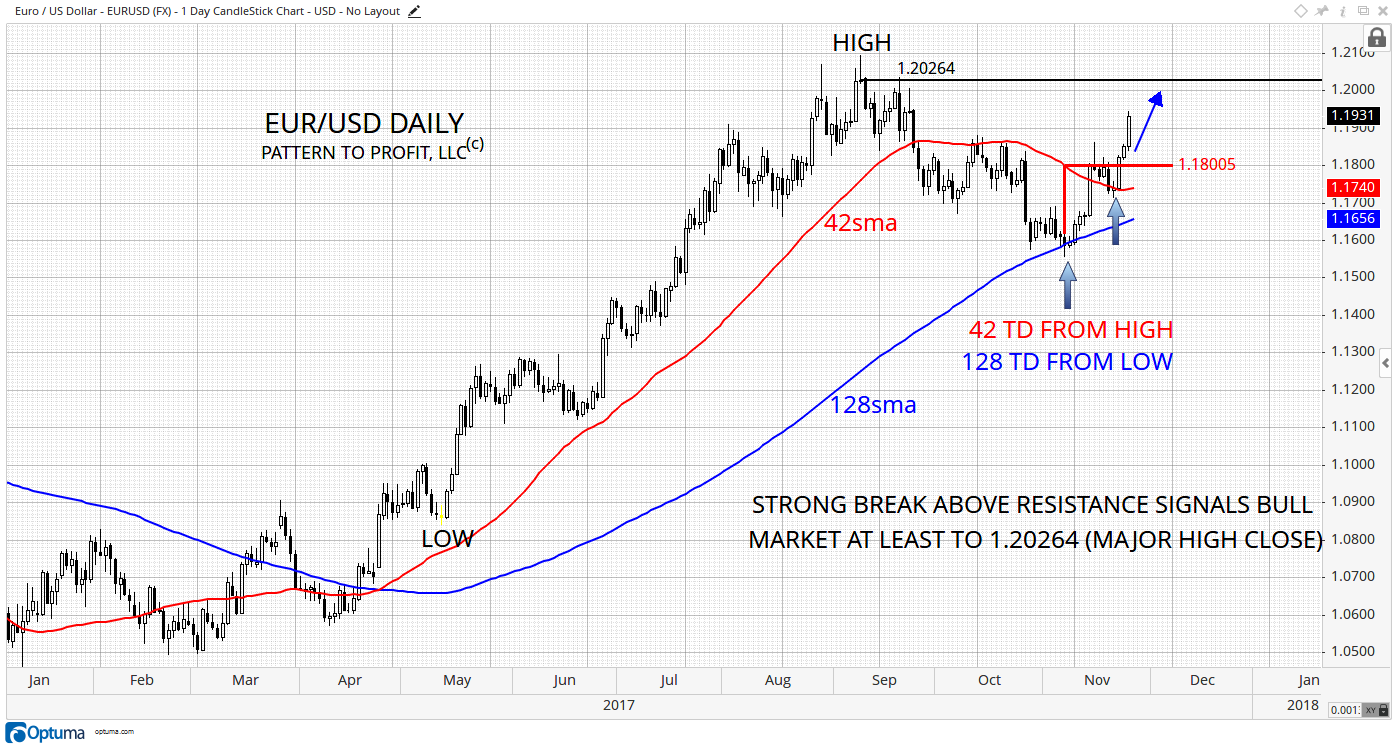
Notice that the recent low of Tuesday, November 21 found support from the continuing 42sma, with resistance offered to the three October highs.
These are all bullish indications, with the market expected to reach previous highs in the 1.2025 – 1.2100 range, at a minimum.


Leave A Comment