
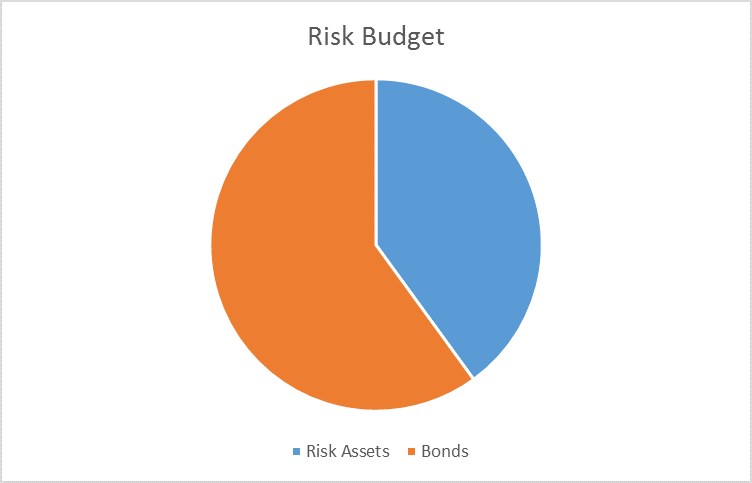
The risk budgets are unchanged again this month. For the moderate risk investor, the allocation between risk assets and bonds remains at 40/60. It was tempting to raise the risk allocation this month and up our allocation to the weak dollar investments we’ve favored for some time. But the only indicator that really improved was credit spreads and it was not sufficient to break the widening trend. There wasn’t enough change in the other indicators to justify increasing our risk posture.
As I noted in the most recent Bi-Weekly Economic Review, the US economic data has recently turned softer, with negative surprises far outnumbering the positives. Q1 GDP was weak and so far I see no reason to expect Q2 to be any better. Inventories are still too high, investment is still too low and the two areas that have been positive for growth – autos and housing – are slowing. Residential investment was a positive for GDP in Q1 but recent reports show slowing housing starts and permits. The auto industry, like a lot of others, has an inventory problem and sales peaked months ago. This economic weakness is a continuing source of concern and has been a major factor in the US dollar decline – a decline that has played a large role in determining investment outcomes this year.
Indicator Quick Review
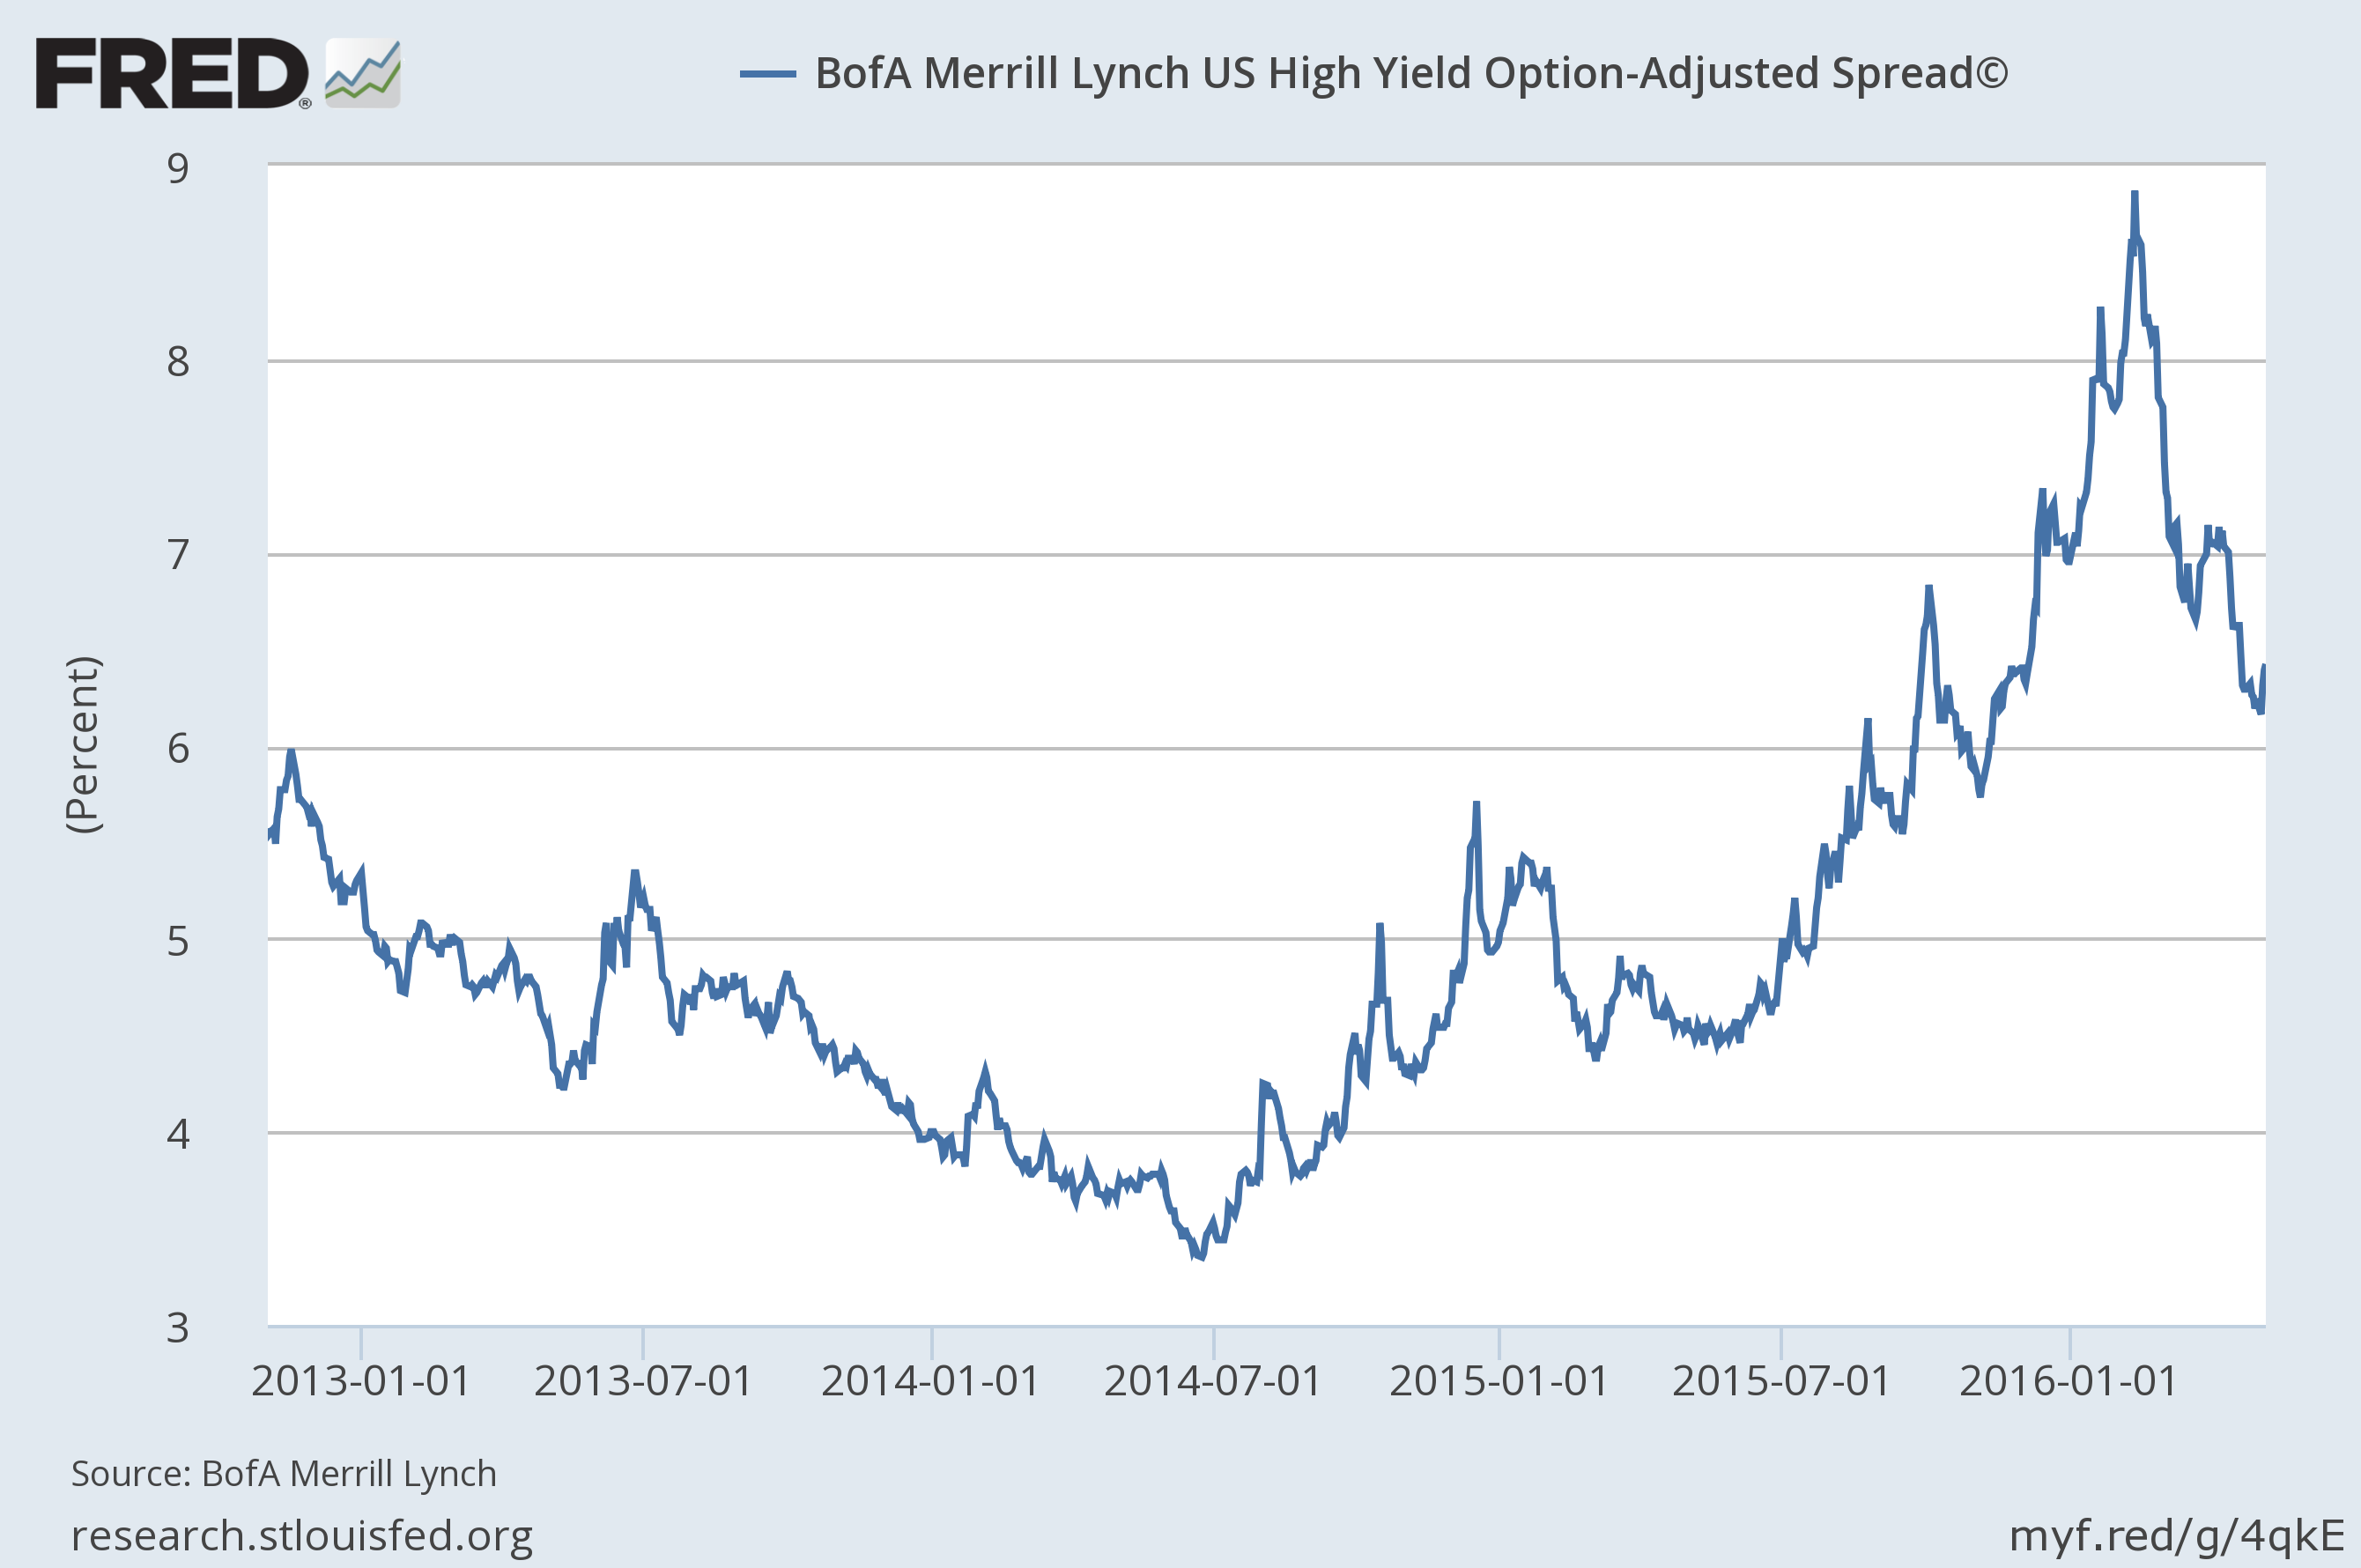
Credit Spreads
Credit spreads continued to narrow over the last month but not enough to break the trend. Spreads are moving in lock step with oil prices at this point, a mistake in my opinion. The credit cycle appears to have peaked and while energy may be the majority of the problem for now, it won’t stay that way if the economy continues to slow. Having said that, I was tempted – sorely tempted – to raise our risk allocation based on the recent narrowing of spreads. In the end I decided the breakdown in the dollar was not definitive enough to warrant increasing the international stock or commodity allocations. And if risk is added anytime soon that is where it will have to be since valuation and momentum are both currently negative when it comes to US risk assets.
Spreads narrowed last month but the widening trend is still intact.
Here’s another way to look at this relationship that makes the trend a little clearer. This is a ratio chart of IEF (7-10 year Treasuries) vs HYG (Junk bonds). When the chart is rising, Treasuries are outperforming junk. That has been the trend since mid-2014 and it hasn’t changed. The recent movement is best described as a correction in an ongoing trend. That could still change but certainly from this one can’t draw that conclusion.
Treasuries versus Junk


Leave A Comment