
The big picture for gold continues to strengthen.
In 2016, gold began the year at about $1100, soared $300 an ounce to about $1400, but then it gave back about $250, and ended the year at about $1150 with only a $50 gain.
That price action fit perfectly with my 2014 – 2017 theme of “rough sideways action, initially with a downside bias that develops into an upside bias”.
The year 2018 should see solid Chindian demand, a reversal in US money velocity, and a peak in mine supply. That should push gold up from the enormous sideways trading pattern and into a substantial uptrend.
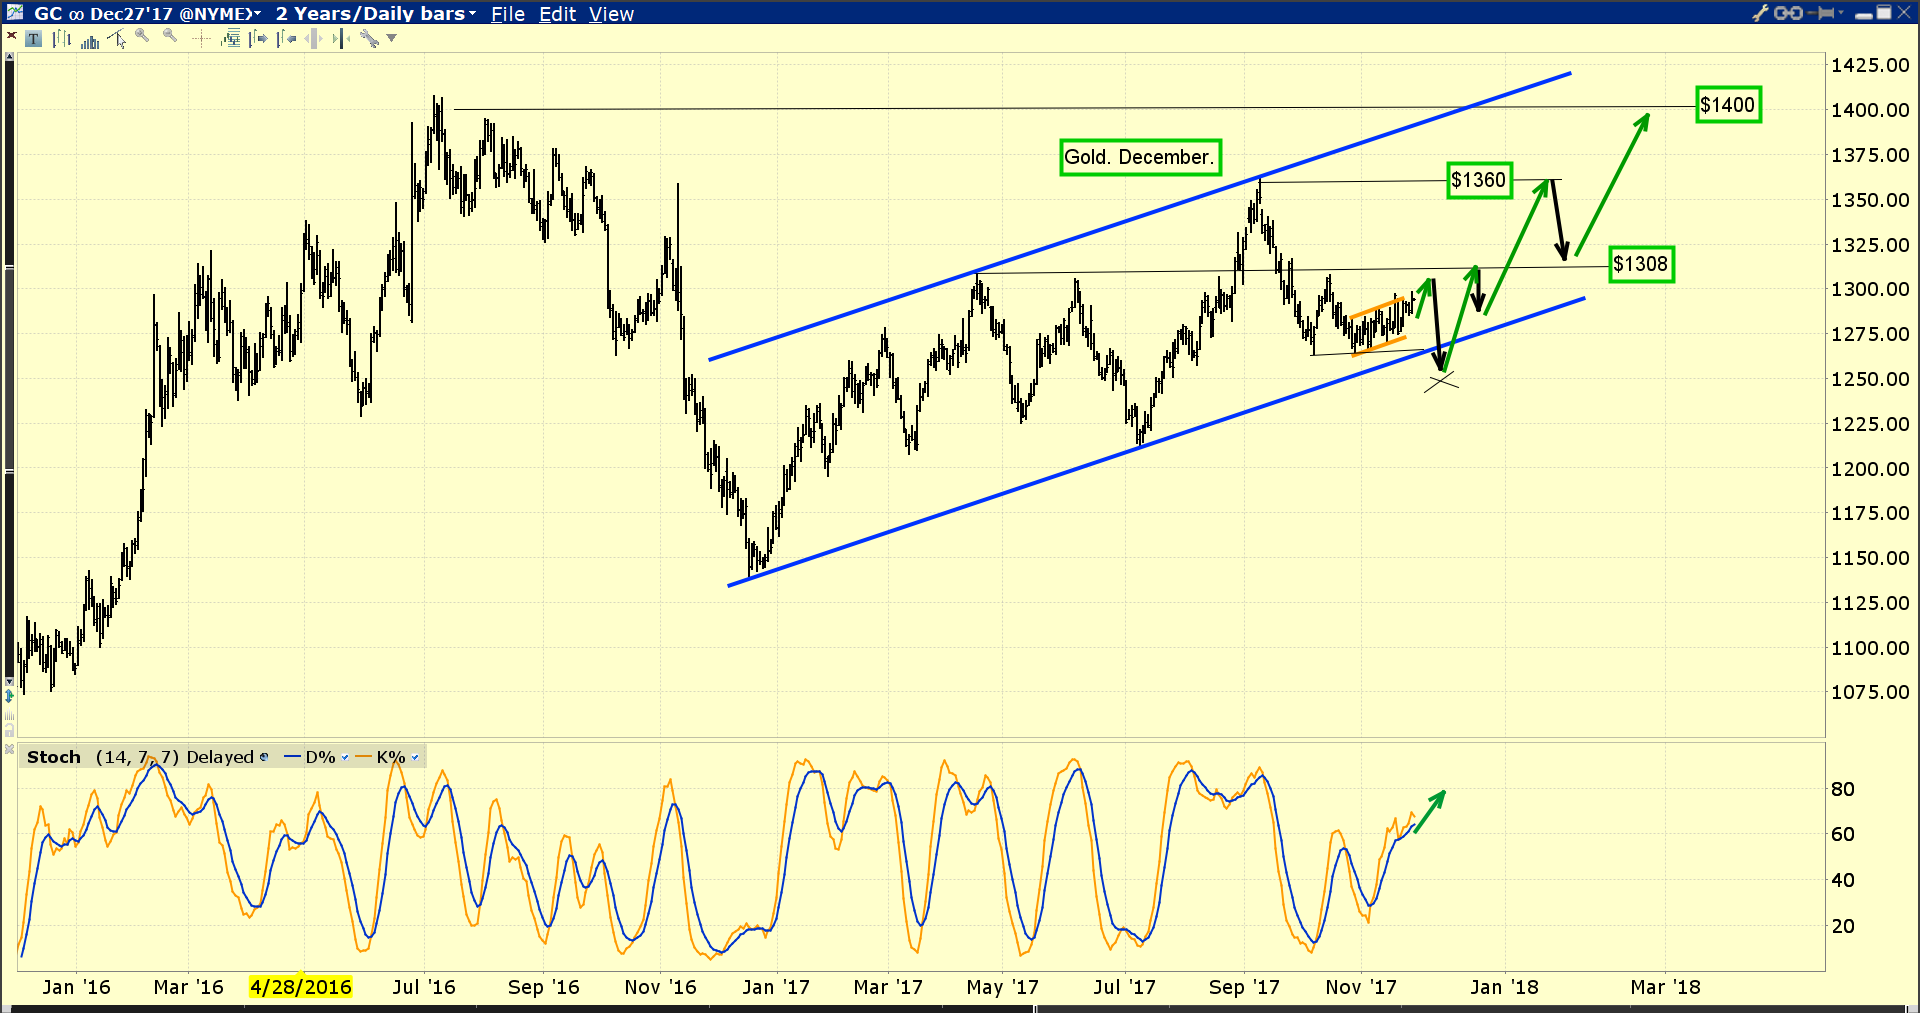
Double-click to enlarge this key weekly gold chart.
Note the fabulous increase in volume since 2016. This is very positive.
One of my most important market mantras is that fundamentals make charts. I postulated the “gold will trade sideways with a slight downside bias” thesis in 2014 because I saw gold price discovery transitioning (slowly) away from the fear trade of the West and towards the love trade of the East.
The imposition of the vile 10% import duty in India put millions of jewelry workers on the unemployment line and it caused a huge restructuring of the jewelry industry.
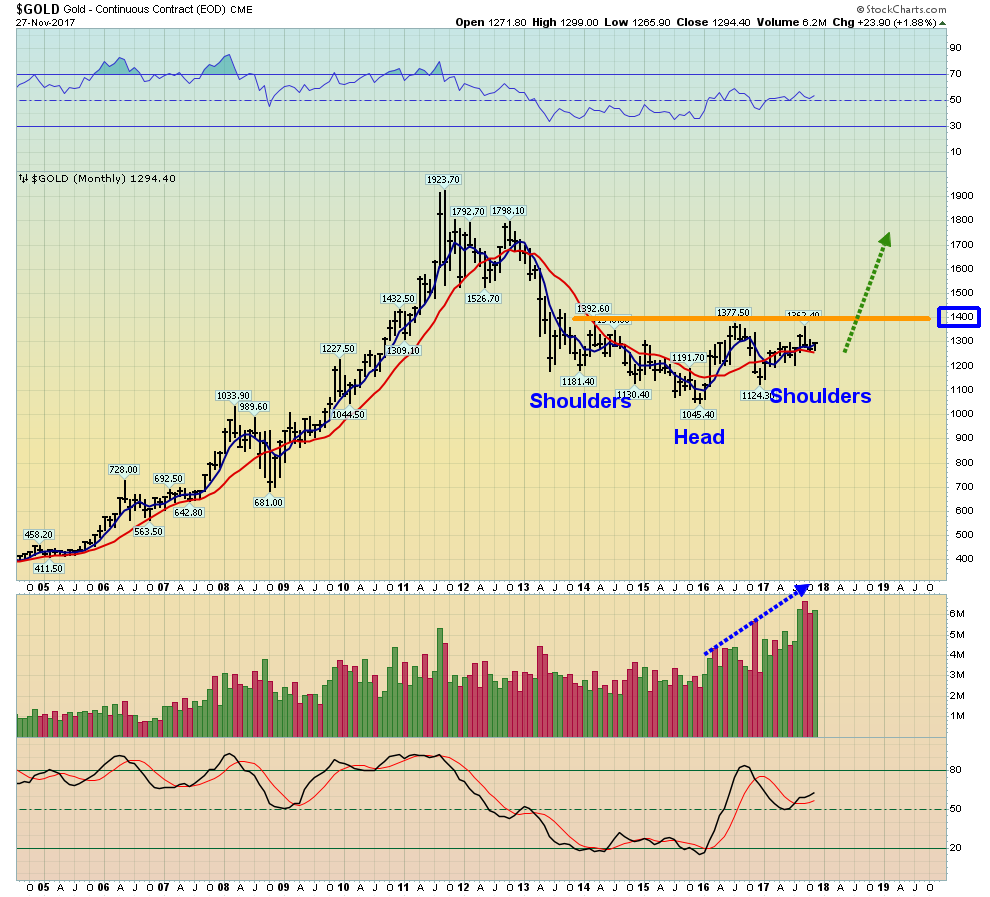
The way it was playing out fundamentally suggested that an enormous inverse head & shoulders pattern would be created as that restructuring progressed.
The transition in America from deflation to inflation and the peak in mine supply are supporting fundamental factors for the way the inverse head and shoulders pattern has been built.
The bottom line is that in the right shouldering area of a massive inverse head and shoulders bottom pattern, investors should expect the price to trade sideways with an upside bias, and as the pattern nears completion, that upside bias will intensify.
That’s exactly what is happening now. Gold is poised to end 2017 giving back very little of what it gained.


Leave A Comment