
A Few Remarks on the Technical Situation
In our last update on gold and gold stocks we discussed a simple method to identify whether or not an upturn was likely to morph into a longer term rally or not, based on market behavior near past major lows. This particular test is obviously still ahead of us.
In the meantime, the short term correction we suspected would soon begin has indeed commenced (there was one more strong up day right after the above mentioned post). As we pointed out, with gold approaching its 200-day moving average (silver had already reached it), one had to expect a pullback regardless of what the medium to longer term trend would eventually turn out to be.

Photo credit: Frantzesco Kangaris / Bloomberg
Here is a look at both metals:
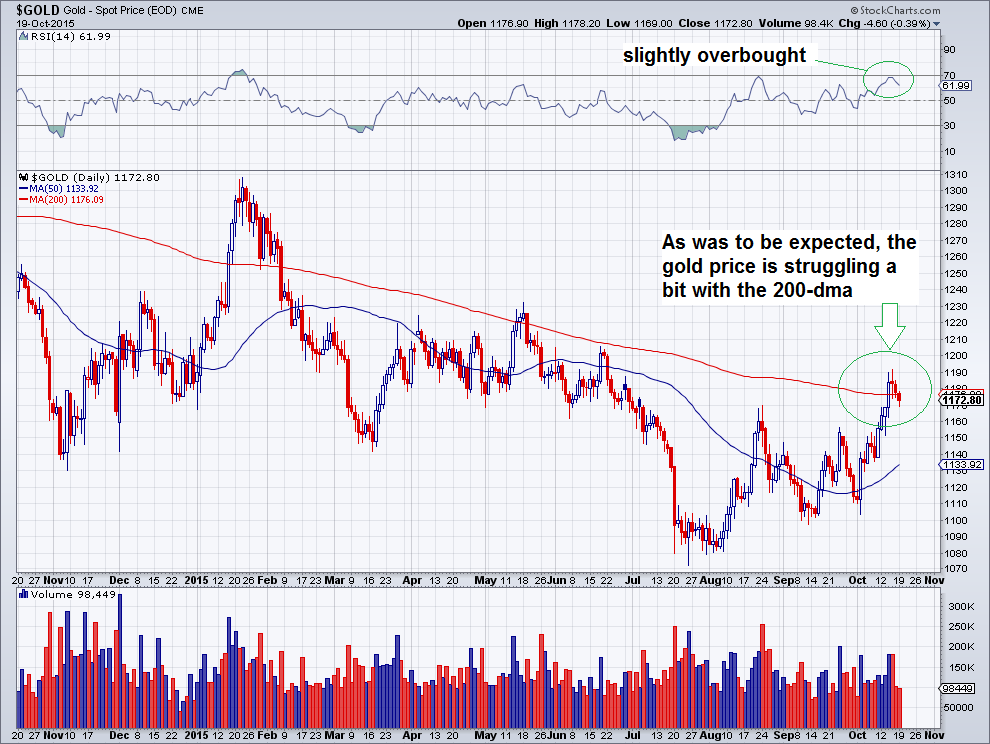
Gold runs into its 200 day ma and pauses. This is no surprise, as this moving average has contained a great many previous rally attempts – three in the past year alone, including the failed breakout attempt in January.
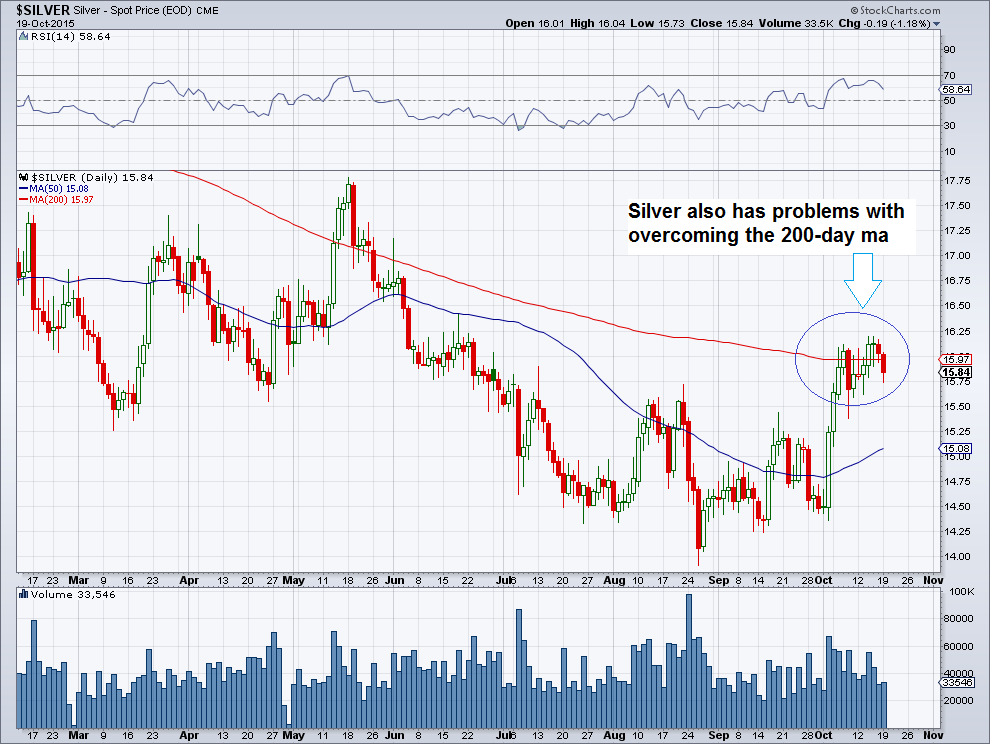
Silver is similarly hampered by its 200-dma, at least in the short term
Both metals have become slightly overbought as well, so traders are evidently reluctant to jump aboard at this particular juncture. There is however some statistical evidence that gold’s recent close above the 200-day moving average may be more meaningful this time. As Jason Goepfert of sentimentrader reports:
“Gold has broken above its 200-day average for the first time in 100 days once again. That’s the third time in the past five years. It has had multiple failed breakouts after being below its 200-day average for more than 100 days several times in the past 40 years. The third time it managed to break above its average coincided with sustained rallies during the next 1-3 years. One caveat (besides the small sample size) is that there were a few times that it *just missed* the 100-day cutoff, which would have preceded the long term bottoms by several months at least.
Obviously this statistic has to be taken with a grain of salt given Mr. Goepfert’s reservations noted above, but we wanted to mention it for the sake of completeness. It is clear though that pullbacks can also be quite informative, so we now have an opportunity to get a better handle on the nature of the recent rally.
If a trend change is underway, then pullbacks in gold stocks should remain relatively contained, either by a typical Fibonacci retracement level or the 50-day moving average (such as e.g. happened in 2000-2001). Naturally, gold stocks will still tend to magnify the moves in gold itself.
Below is a daily chart of the HUI and the HUI-gold ratio with a Fibonacci grid between the most recent low and high drawn in to show potential retracement levels. We’re not sure if it makes much sense to apply Fibonacci retracement levels to a ratio chart, but it didn’t cost us anything to add them.

The HUI and the HUI-gold ratio with Fibonacci retracement levels. The HUI’s 50-day moving average will soon coincide with the 50% retracement level and the 38% level shortly thereafter. As noted in the annotations, it would be ideal if the RSI could stay above the 40-50 area (this incidentally applies to the metals as well). In bullish trends this level is rarely undercut.


Leave A Comment