
Surprising Strength
Similar to many others, we have been waiting for some sort of correction in gold and gold stocks, but obviously, not much has happened in this respect so far. We have written quite a lot about gold and gold stocks between August 2015 and February 2016, because we felt a good opportunity was at hand – a short term trading opportunity at the very least, but one with the potential to become more than that.

Inside the fully mechanized South Deep gold mine in South Africa. Maybe it’s worth to keep digging for more after all?
Photo credit: Themba Hadebe / AP Photo
The strength in gold and gold stocks that could be observed since then certainly suggests that something more than just a short term trading opportunity is at hand. In early February we showed a chart of how the first corrections in the nascent stage of three previous bull markets played out, with the size of the moves adapted to the chart of today’s HUI index.
Obviously, our expectations have been exceeded quite a bit – if the HUI had mimicked the strongest of these previous initial advances (which took place in late 2000/early 2001), it would have put in a short term peak at approximately 167 points. So far, it has made it to nearly 190 points intraday without correcting much as of yet. As far as we know (we stand ready to be corrected), the HUI’s rally after putting in a new bear market low in mid January has been the strongest sector rally in all of history over such a short time period. It has risen by more than 90% in just two months.
The rally in gold has been far weaker, but this is quite normal at this stage. It has nevertheless managed to overcome a number of short and medium term resistance levels, including a major downtrend line. Gold in USD has essentially followed the gold price trend in terms of other major currencies, which hasn’t really surprised us. Readers may recall that we have highlighted this growing divergence for quite some time.
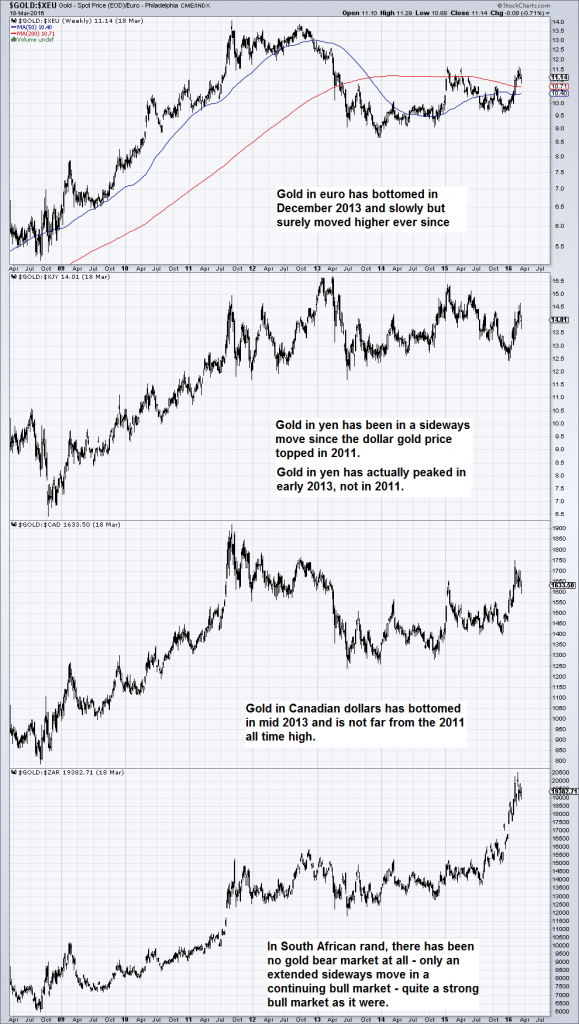
Gold in terms of selected non-dollar currencies: the euro, the yen, the Canadian dollar and the South African rand.
Obviously the extremely strong rally in gold stocks makes a short term correction more rather than less likely. Mainly its timing, extent and duration would normally be open to question. However, overbought conditions have so far been relieved by means of an upwardly skewed sideways move instead of a sharp dip.
One can see this quite well on a 30 minute chart of the HUI that shows the action over the past three months. We haven’t yet given much thought to a possible Elliott wave labeling, but it seems to us that there has to be a “running correction” in there somewhere. This is to say, a corrective structure that exhibits an upside bias and is characterized by continuing the pattern of higher highs and higher lows.
This kind of correction is considered evidence of a very strong underlying trend, as it reflects the urgency of investors to get in. Naturally, a bigger correction could easily begin at any moment. At some point the index should test its 50 day and/or 200 day moving average from above, but it is noteworthy that the sector has so far been strong even on days when gold itself has shown weakness.
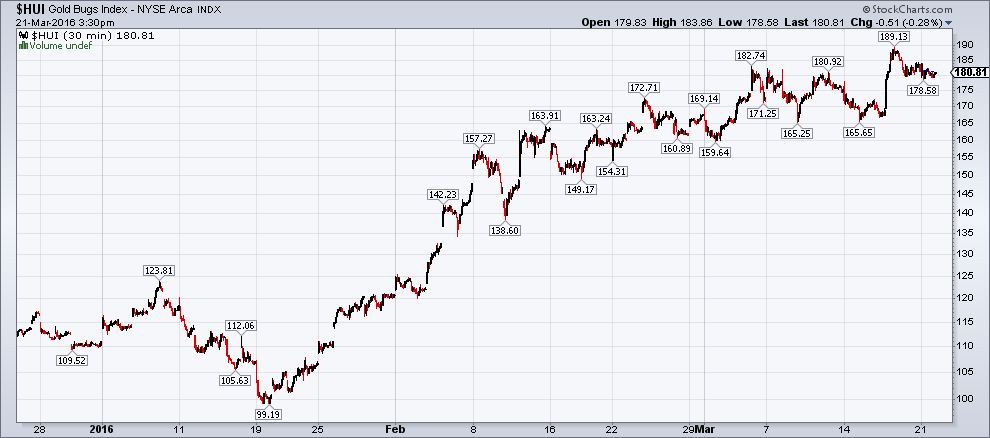
The HUI Index, 30 minute chart – after the initial burst higher, the index has reacted to overbought conditions by moving sideways with an upward bias
A strong rally always invites an increase in bullish sentiment, as sentiment tends to follow prices. In spite of all the recent evidence of technical strength, there is however not as much enthusiasm for gold as one would expect. The severe and long-lasting post 2011 bear market has apparently really worn many market participants down, and the bear market mindset is still quite prevalent.
However, if a new bull market has begun, bear market rules simply no longer apply. This has no bearing on what is going to happen in the short term – with regard to that, we are agnostic at the moment. A fairly sizable correction certainly wouldn’t be a surprise, but as long as short term support levels remain unmolested, it is still possible that a move to new highs will happen first.
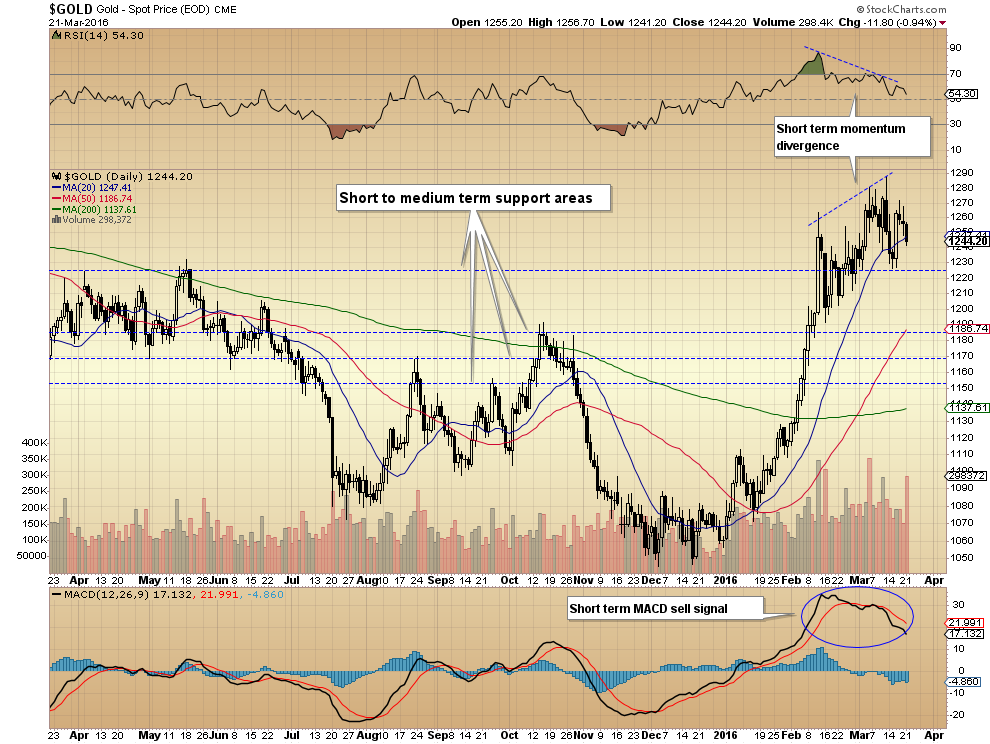
Gold with various lateral support levels penciled in. In the short term, the 20 day moving average (blue) and lateral support just below 1230 are probably important. If they were to be violated, a correction to the vicinity of one of the lower support levels would become highly likely. Even though a negative price/RSI divergence and a short term MACD sell signal have recently been recorded, the possibility of a move to a new high remains open as long as these near term support levels are holding (the same holds analogously for the gold stock indexes)
An Army of Doubters
In recent weeks there has been quite a bit of anecdotal evidence that the rally remains widely doubted. For one thing, many sell-side analysts continue to be quite stingy with upgrades. Numerous gold stocks are still sporting “sell” ratings.


Leave A Comment