
Repeating Patterns and Positioning
A noteworthy confluence of patterns in gold and gold stocks is in evidence this year. At the close of trading on December 26, the HUI Index has given a (tentative) buy signal by completing a unique chart pattern, which is why we decided to briefly discuss the situation. As usual, things are not as straightforward and simple as they would ideally be, but there is always an element of uncertainty – one has to accept that as a given. Let us look at a chart illustrating one of said patterns:
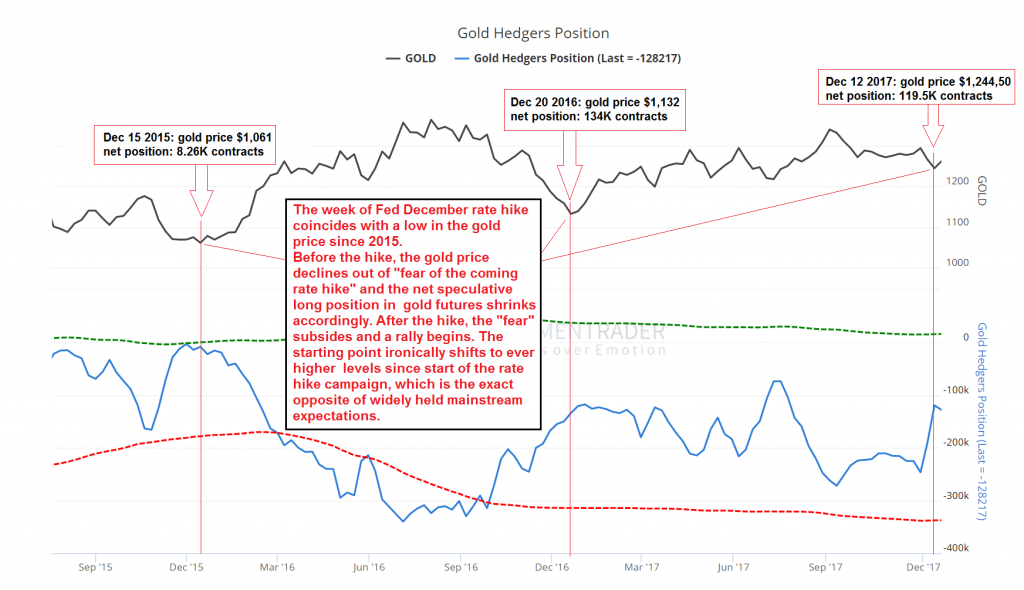
This chart shows the gold price, the weekly net hedger position in gold futures (the inverse of the net speculative position), with the Fed’s December rate hikes in 2015, 2016 and 2017 highlighted by red vertical lines. Keep in mind that the December 2015 hike was the start of the current rate hike campaign. In the weeks leading up to it, the gold market was in the grip of a bearish hysteria, just as it approached a major lateral support level. Nearly every day Bloomberg, Reuters and other mainstream financial media published articles by “experts” no-one had ever heard of before (or since!), along with reports from analysts working for various well-known investment banks, all of whom stridently insisted that the beginning rate hike cycle was going to be the most bearish thing that could possibly befall the gold market, and that a further collapse in prices was nearly certain to coincide with it. Not surprisingly, the exact opposite has happened. You were definitely not surprised if you were reading this blog at the time – see for instance “Gold and the Federal Funds Rate”. As we pointed out therein: “[The] guessers at SocGen might actually have improved their statistical odds a bit if they had said “now that the Fed is hiking rates, gold prices should rise”. As noted in the chart annotation, in all three years gold prices declined into a December low, seemingly driven by fear of the coming rate hike and then proceeded to rally in a typical “buy the news” scenario. The declines tended to lower net speculative long positions to levels conducive to a renewed advance. So far the gold price lows coinciding with these rate hikes are increasing by approximately $100 per year. We expect this uptrend to accelerate noticeably once the rate hike campaign is unceremoniously thrown overboard. ETA: sometime next year, the precise timing depends on when the asset bubble peaks and reverses – the clock is ticking on that – click to enlarge.


Leave A Comment