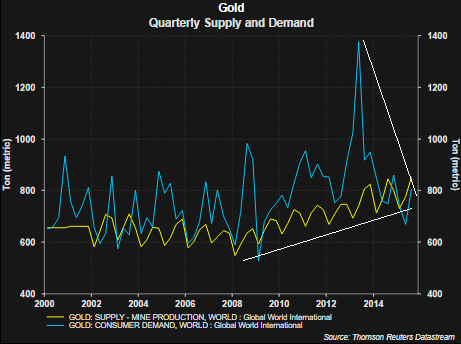
Gold prices have not been immune to the broader issues facing the overall commodity market. Year to date, the price of gold is down 10.8% while the broader CRB Commodity Index is down 20.3%. A part of the issue negatively impacting the price of gold is output is outpacing demand. With the decline in the price of gold the cost to extract gold exceeds the market price in many cases.

From The Blog of HORAN Capital Advisors
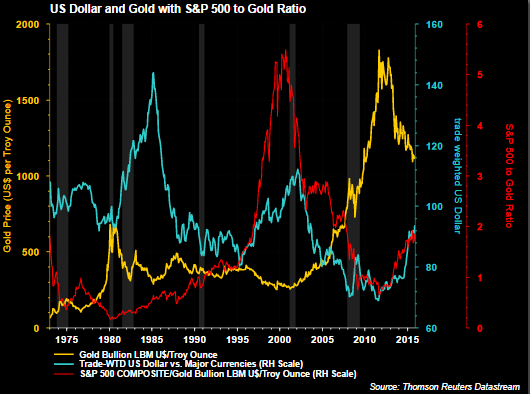
More importantly though, gold is mostly transacted in US Dollars and the strength in the Dollar is a headwind for the price of the metal. The light blue line in the below chart represents the trade weighted Dollar Index compared with gold prices (yellow line). The lines show gold price weakness as the Dollar strengthens. Gold has a negative .65 correlation to the trade weighted Dollar index. With the Federal Reserve nearing lift off for U.S. rates, additional Dollar strength will likely be an outcome into 2016.
From The Blog of HORAN Capital Advisors
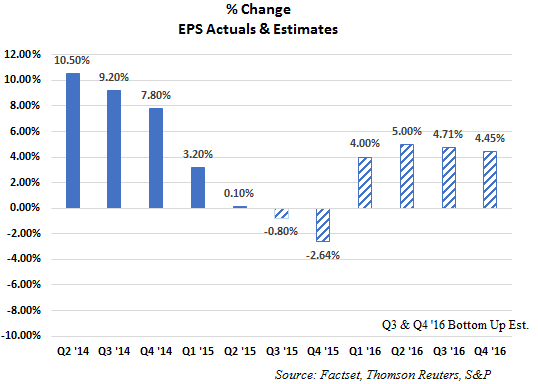
Additionally, the red line in the above chart shows the ratio of the S&P 500 Index to the price of gold. This ratio has a positive correlation to the trade weighted dollar and is partly a result of weaker gold prices as the Dollar rises. Another important factor that contributes to the upward sloping red ratio line is a rising S&P 500 Index. The obvious factor that contributes to higher equity prices is the growth in earnings and therein lies the issue for equity prices. As the below chart shows, earnings growth for the S&P 500 Index will be negative for two successive quarters if earnings are negative for the fourth quarter. This would be the first back to back quarterly earnings decline since 2009. The second chart below shows 12-month forward earnings estimates for the S&P 500 Index and the negative growth expectations are weighing negatively on recent S&P 500 returns.
From The Blog of HORAN Capital Advisors


Leave A Comment