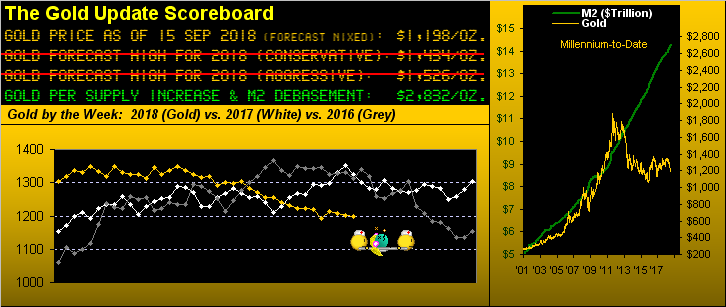
To state that Gold closed down for the week — indeed down for the 12th time in the past 14 weeks — but that price’s trend flipped up from Short to Long — is justification to ring up the LTS (Looney Tune Squad) for the author to be carted away.
To be sure, mathematical measures of markets can materially meander, marring not so much the truth as the numbers don’t lie, but belying it. Oxymoronic perhaps, but if doctrinaire use of technical analysis always led to profitability, “we’d all be rich”, in reality an impossibility as there’d be no one taking the other side of the trade.
“Where on earth are you going with this?” you may ask.
With respect to Gold’s seemingly endless parabolic Short trend by the weekly bars, you’ll recall the following sentence as penned a week ago: “Price need just trade up through 1213 in the ensuing week to end this trend toward rounding the next upside bend.”
And it happened this past Wednesday, at 10:00 Pacific Time to be precise, the Dollar getting ditched within a frenzy of renewed hopes for resolving trade issues with China and pro-Brexiters giving Prime Minister May a bid. Indeed Gold furthered its modest climb to 1218, a level not pipped since August 28– before giving it all up and then some to close out the week yesterday (Friday) sub-1200 at 1198, its second-lowest weekly settle since that ending 27 January 27, 2017. Not very impressive, right?
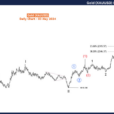
But the intra-week price pop was enough to end the 19 weeks of parabolic Short trend — the third lengthiest millennium-to-date — which “short” of leaving us speechless at least garners an “Oh goodie…” as the first encircled blue dot of the new parabolic Long trend (meanderingly or otherwise) appears:

Of course the burning question from the “History Repeats Itself Dept.” is: how did the price of Gold fare following the other two Short trends of even greater duration?


Leave A Comment