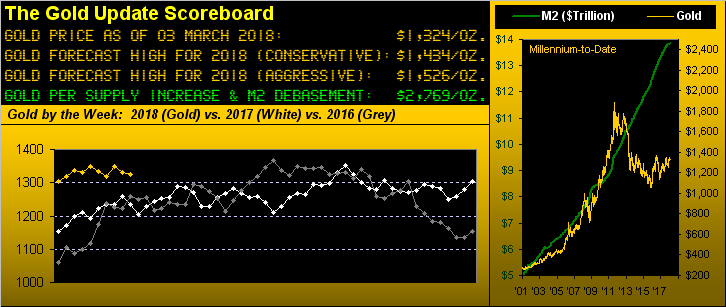

Two trading months plus two days of 2018 already gone yet across the US and into Europe it hardly feels like Spring. Neither springing so far this year is Gold.
In looking at our above opening scoreboard, Gold is trading at higher levels than it was to this point in both of those prior two years. But 2018’s price track clearly lacks the spring and upside tilt seen early on in 2017 and 2016. Indeed Gold’s having just been poised a mere 10 trading days ago at 1364 to spring up and over the hurdle at Base Camp 1377 instead finds price having settled out the week yesterday (Friday) at 1324, trading en route as low as 1304.
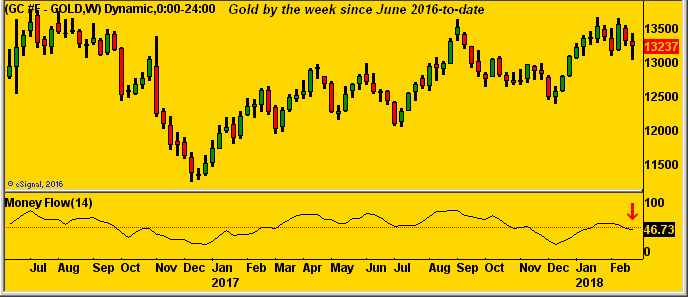
And then there’s this annoying technical note: Gold’s study of “weekly money flow” as we next show has now dipped below the red horizontal line (at 50 on a scale of 100-to-0) in the chart’s lower panel. This is only the sixth such downside crossing since September 2014: in all five of those prior downside crossings, price then traveled further south by at least 32 points (a repeat of which would have us visit those “Whiny 1290s”). We’ll spare you the average number of points south in those prior cases, as on balance, we view Gold to be in fairly firmer stead these days. Moreover, should Gold stay stout such as to pull the money flow study back up above the red line without too much of a price rout, again we’ll be setting our sights on Base Camp 1377.
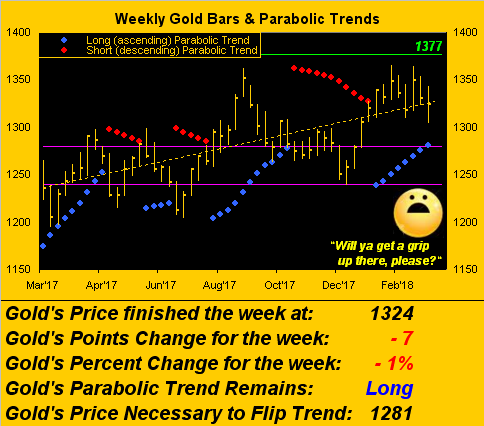
Staying with the weekly bars theme, below we find Gold at 1324 still with some 43 points of clearance above the parabolic flip price of 1281. Yet at present, Gold’s “expected weekly trading range” is 31 points, so by that measure there’s not a lot of space for downside excursion in the next week or two without flipping the trend from Long to Short. So don’t flip: get a grip.
It being month’s end plus two days into March, it’s time to go year-over-year with Gold alongside these precious metals’ equities as follows: from best-to-worst we’ve Franco-Nevada (FNV) +15%, Newmont Mining (NEM) +13%, Gold itself +7%, the VanEck Vectors Gold Miners exchange-traded fund (GDX) -1%, the Global X Silver Miners exchange-traded fund (SIL) -13%, and Goldcorp (GG) -17%. The overall picture is somewhat analogous to old Uncle Harry’s vital signs monitor clamped onto the head of his hospital bed: “But the lines always do better when Nurse Penelope comes in!” If anyone needs some stimulative nursing out there it’s Silver: its present denominator price of 16.353 and Gold’s numerator of 1323.7 continue to make for an historically high ratio Gold/Silver of 80.1x vs. the millennium-to-date average ratio of 63.0x … beep… beep…beep.


Leave A Comment