
Here in wee Monaco amongst its most famous district Monte-Carlo lies the “Carré d’Or” or “Golden Square”. The name is perfectly analogous to the ongoing, spoiled attitudinal state of late for Gold: ’tis acting like a “square”, continuing as ever to not go anywhere.
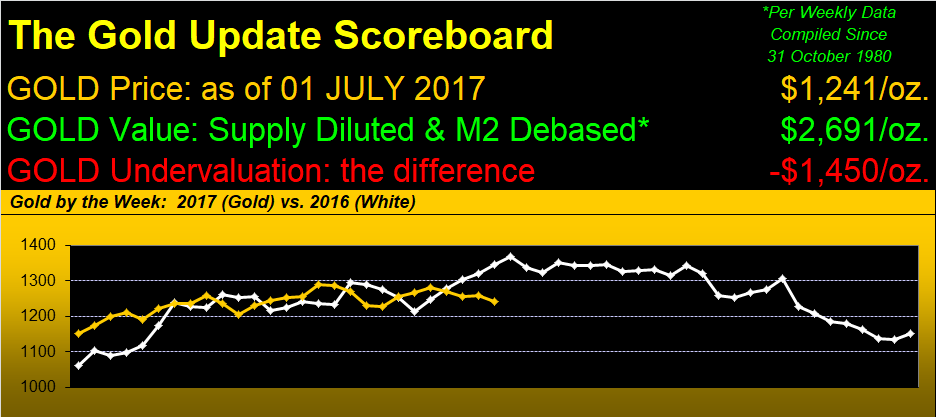
Further, as the above panel shows, Gold now lies -104 points (or -7.7%) from where ’twas at mid-year in 2016, still choosing to be docked in its 1240-1280 box, wherein week-after-week little opportunity knocks. To be sure for the long-term stacker, averaging in at the same price over and over rather defeats the whole purpose.
Moreover with precisely one-half of 2017 in the bag, the precious metals have finally lost what had been their cheery month-after-month leading role within the BEGOS Markets as we see below, the chart-topping component now being the Euro! And from “The Dept. of Never Say No“, coming in second is the ever-correctionless S&P 500, don’t you know, our “live” price/earnings ratio therein at 34.3x … oh say it ain’t so!
So here are the current year-to-date standings, with Gold ’round the center row. And query this: ought Silver’s performance really be so low (+4.2%), given not just Gold’s is almost double (+7.8%, most of which came in the year’s first two months), but that Copper’s too is +7.9%? The average Gold/Silver ratio millennium-to-date is 62.4x, but presently is 74.8x. To price Silver back up to that average means an increase of 19.9% (which from today’s level of 16.625 would bring us to 19.930). Just sayin’…
Specific to this past week, Gold settled yesterday (Friday) at 1241. How comparatively narrow has become Gold’s trading range? Its “expected weekly trading range” is now 28 points: a year ago, that was just about Gold’s “expected daily trading range” (25 points). Squished in range and squished in its purple-bounded 1240-1280 box, here are Gold’s weekly bars, the parabolic Long trend now four weeks in length without a wit of upside price movement:


Leave A Comment