
The Precious Metals sector continues to be viewed with disdain and skepticism by the vast majority of investors, which is exactly what you want and expect to see at the earliest stages of a major bull market. However, the charts continue to shape up well, as we will now see.
Starting with the long-term 10-year chart for gold, we see that it is approaching completion of a more or less symmetrical complex Head-and-Shoulders bottom, with multiple shoulders. It is now believed to be rising up to complete the final Right Shoulder, that should be followed by a breakout above the resistance at the top of the pattern, which will be a positive technical development of huge significance.

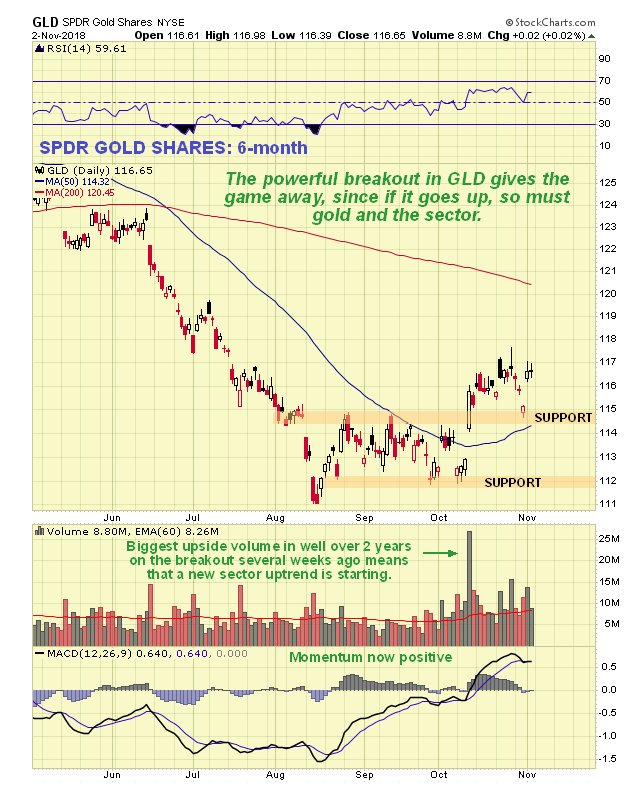
On the 6-month chart, we can see consistently positive technical action in the recent past, as gold made a clear breakout from a Double Bottom with a fine large white candle on very heavy volume on 11th October, a sign that it “means business”. It is thus not surprising that the test of support at the top of this base pattern a few days ago was successful, amply demonstrated by another big white candle as it decisively reversed to the upside again on Thursday.

Gold’s latest COT remains very bullish, with Large Specs having virtually no enthusiasm for gold at all. Note that the slight buildup in the Commercials short positions over recent weeks is justified, given that gold is up significantly from its early October lows, and the main point to note is that this chart shows that there is plenty of room for a big rally by gold before COT positions become extreme.
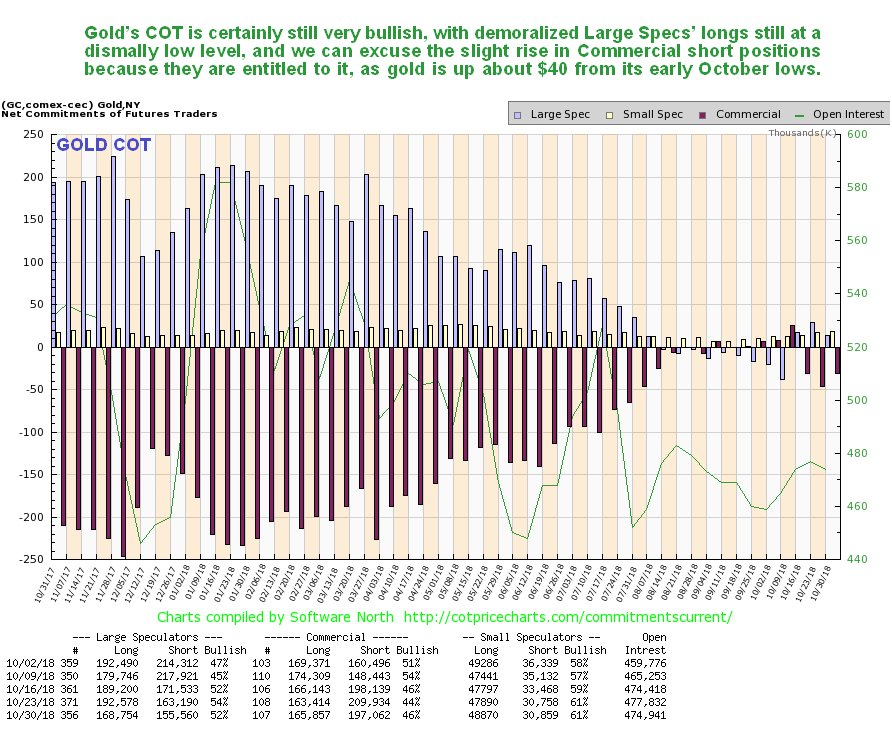
Click on chart to pop up a larger, clearer version.
Gold Hedgers’ positions are still very positive for gold overall, despite easing back from their extreme of early October…
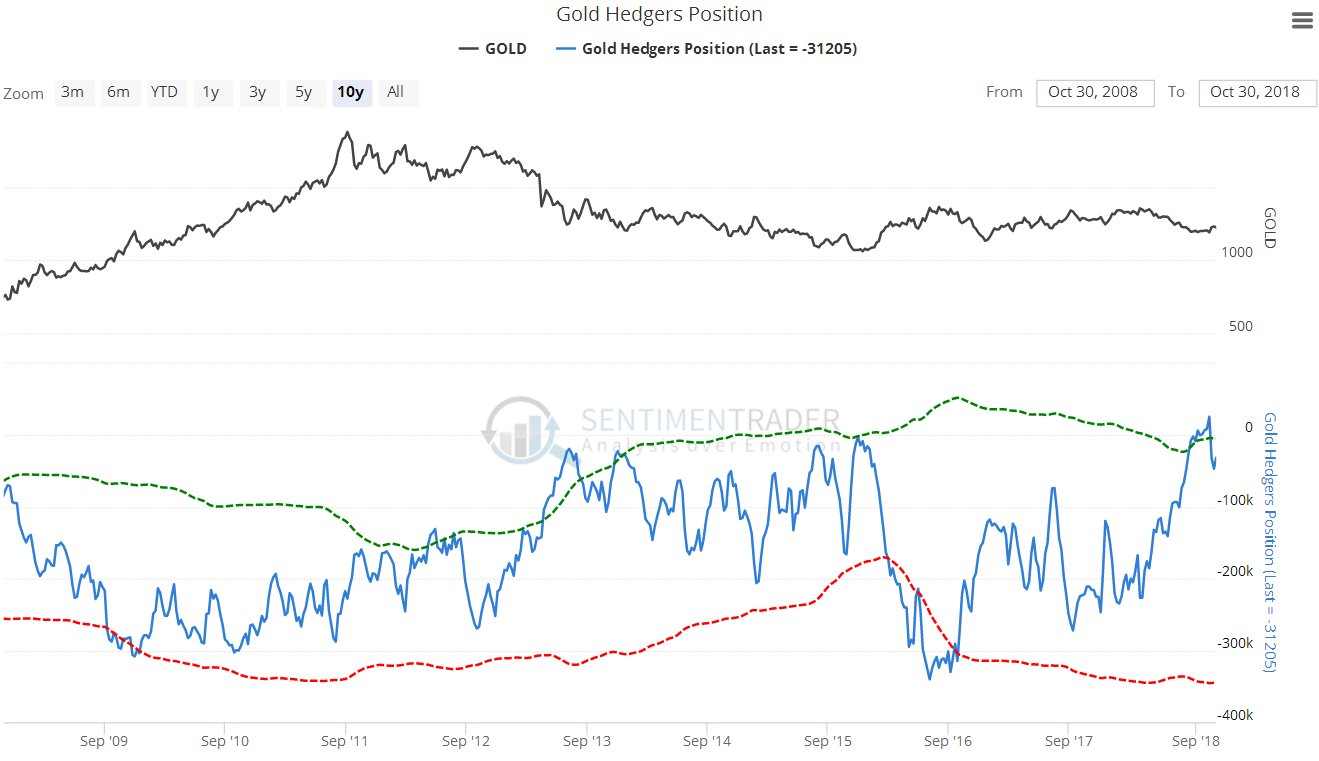
Click on chart to popup a larger, clearer version.
Chart courtesy of sentimentrader.com
Although gold did alright last month, October is on average a rather poor month for gold, on the basis of seasonal factors, as we can see on its seasonal chart below. However, November, which we have just entered, is much better and is actually the 2nd best month of the year for gold, seasonally, and although a background factor, it’s a help…
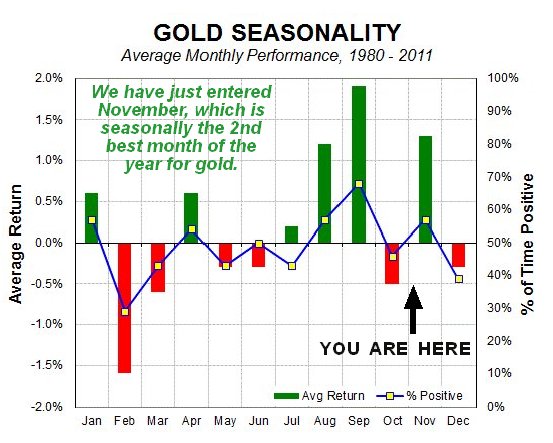
Chart courtesy of sentimentrader.com
The chart for gold proxy SPDR Gold Shares in even more bullish than the chart for gold itself, as it sports a powerful high volume breakout from its base pattern several weeks back. We also saw a successful test of support by GLD last Wednesday
Gold stocks indices also present a very bullish picture. On the chart for GDX, which is an accurate PM stocks proxy, we can see the big down day about 10 days ago which freaked out many more nervous investors in the sector, yet this was just a test of support at the “neckline” of the Head-and-Shoulders bottom pattern, which we had anticipated, although it was a bit of a “nail biter” on the day it dropped through the neckline, only to bounce back to close above it by the end of the day. Action late last week was positive with it rising away from the neckline again. There was a convincing breakout from the H&S bottom earlier in October, with a big up day on the highest upside volume since March 2017. With respect to the larger picture, GDX has quite a bit of work to do to turn it really positive, which will involve it rising sufficiently to take the 50-day moving average up through the 200-day, that is still quite some way above, and working its way through the considerable resistance between approximately 21 and 24.


Leave A Comment