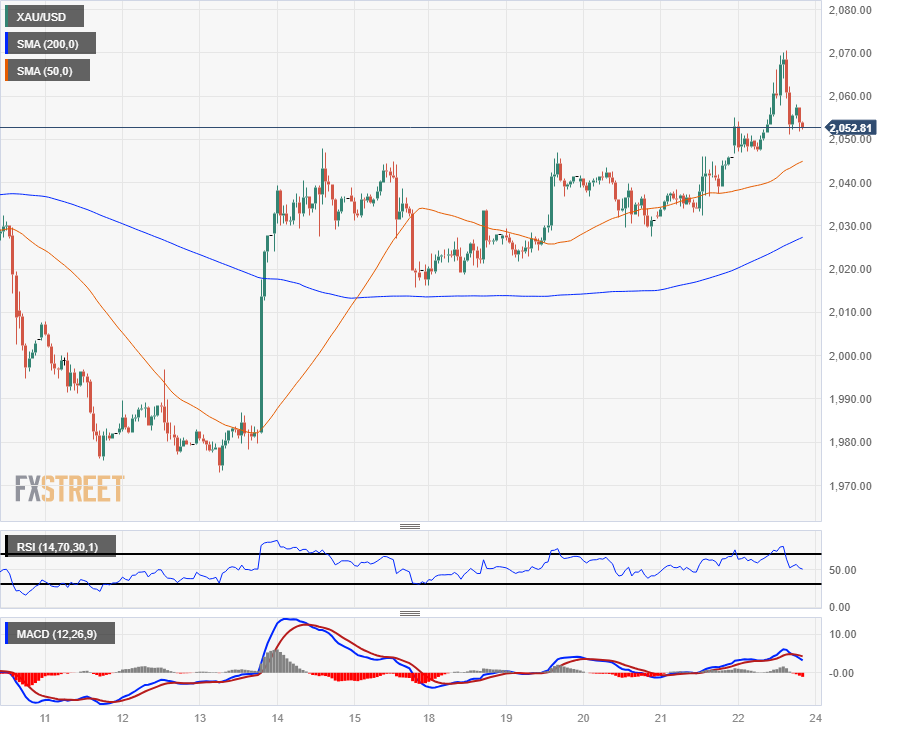
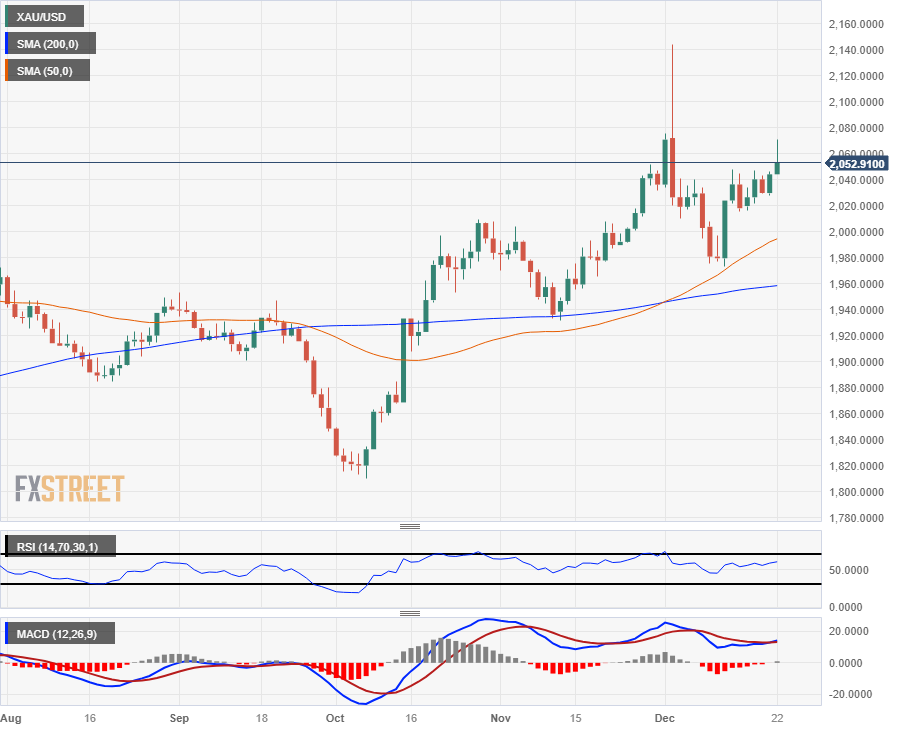
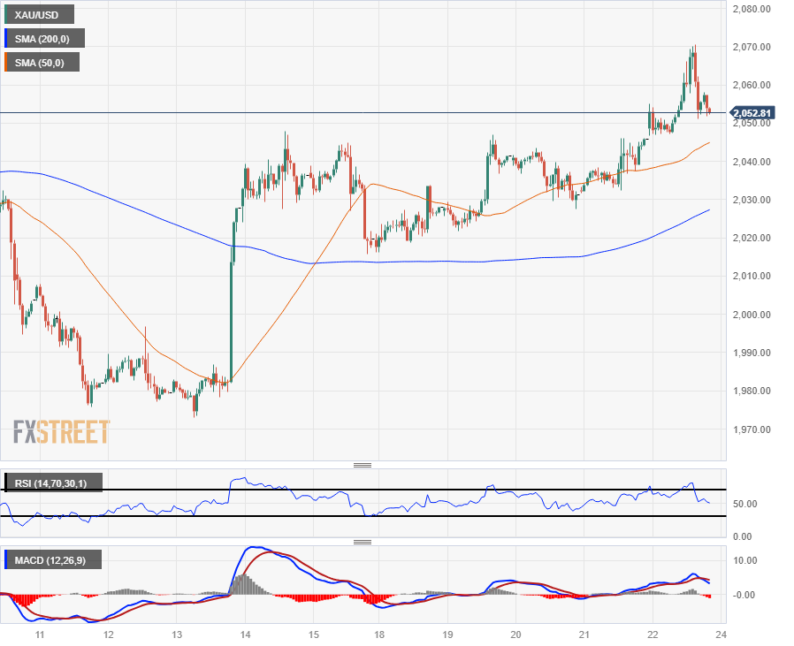
XAU/USD briefly tested above $2,070 on Friday before paring back toward the day’s opening bids. With the Federal Reserve’s (Fed) main interest rate at a 22-year high, markets are incredibly eager for the Fed to begin cutting interest rates, and receding US inflation is pinning investor hopes of an accelerated pace of Fed rate cuts in 2024.The US Annualized Core Personal Consumption Expenditures (PCE) Price Index in November grew by 3.2% from the same time last year, easing back from market forecasts of 3.3% and declining further from the previous period’s 3.4% (which was also revised down from 3.5%).With US inflation easing back, markets are applying downside pressure to the US Dollar and bidding up Spot Gold in anticipation of Fed rate cuts that may have run too far ahead of what the Fed will be willing to execute; the Fed’s dot plot of interest rate expectations show a median forecast of 75 basis points in rate cuts through the end of 2024. By comparison, markets are currently pricing in bets of 160 basis points in cumulative rate cuts, with some particularly over-eager market participants betting on a rate cut as soon as next March.With markets wrapping up the last full trading week of 2023 and gearing up for the holiday market break, Friday’s early action saw a notable reversal as the US Dollar pared back the day’s losses and Gold retreated back towards the day’s opening bids. XAU/USD Technical OutlookSpot Gold climbed over 1.10% bottom-to-top on Friday in a last-minute bull run before hitting the wall at $2,070 and reversing back toward Friday’s open near $2,050. Intraday action in the XAU/USD has been incredibly well-bid as of late, outpacing the 200-hour Simple Moving Average (SMA) since breaking to the topside of the moving average last week near $2,020.A higher-lows pattern has baked into the XAU/USD on daily candles since Spot Gold bottomed out near $1,820 in early October, and long-term technical support is coming from the 200-day SMA rising into $1,960.December’s early rally into all-time highs has left near-term Gold bids stranded in bull country, and XAU/USD will have to fall back below the $2,000 major handle before bearish patterns can begin to develop. XAU/USD Hourly Chart  XAU/USD Daily Chart
  XAU/USD Technical Levels XAU/USD
More By This Author:USD/CAD Claws Back To Flat On Friday In Pre-holiday Greenback Rebound, Just Below 1.3300
Pound Sterling Eyes More Upside On Upbeat UK Retail Sales, Soft US Core PCE Data
USD/CAD Remained Weak Below 1.3300 After Canadian, US Data


Leave A Comment