
Gold prices continued to edge lower as a supportive round of US economic data bolstered Fed rate hike bets and drove the US Dollar higher, undermining support for anti-fiat assets (as expected). Follow-through proved limited however as markets look ahead to Friday’s official US employment figures before showing strong directional conviction.
In the meantime, the PCE inflation gauge – the Fed’s favorite – is in the spotlight. The price growth rate is expected to have slowed to 1.4 percent in July, the weakest since December 2015. Disinflation has bedeviled Fed policymakers all year and goes a long way to explaining the markets’ dovish disposition. An upside surprise echoing recent news-flow may make for a potent counter-argument.
Crude oil prices continued to drift lower amid worries about refinery disruptions courtesy of Tropical Storm Harvey. EIA data showing inventories shed 5.39 million barrels last week, parroting expectedand smashing forecasts calling for a 1.9 million outflow, provided only brief relief. Monthly DOE supply statistics are on tap ahead but Harvey-related news flow may continue to take top billing.
GOLD TECHNICAL ANALYSIS – Gold prices continue to retreat after failing to hold onto an intraday breach of the 38.2% Fibonacci expansion at 1311.94. A daily close below resistance-turned-support at 1295.46 sees the next downside barrier at 1275.34, the August 25 low. Alternatively, a daily close back above 1311.94 exposes the 50% expansion at 1323.25. Negative RSI divergence argues in favor of a downside scenario.
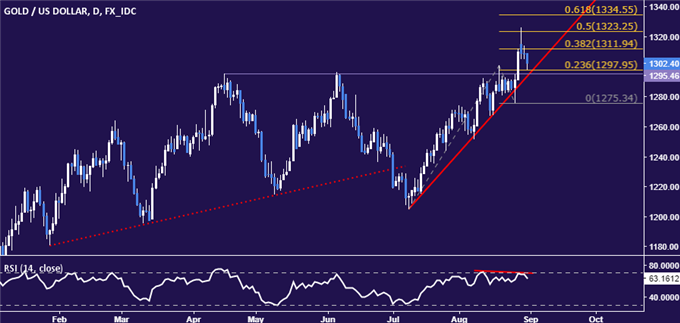
Chart created using TradingView
CRUDE OIL TECHNICAL ANALYSIS – Crude oil prices continue to edge toward support at 45.46, the 50% Fibonacci expansion. Breaking below that on a daily closing basis exposes the 42.08-84 area (June 21 low, 76.4% level). Alternatively, a reversal back above the 38.2% Fib at 46.62 opens the door for a retest of support-turned-resistance at 48.76.


Leave A Comment