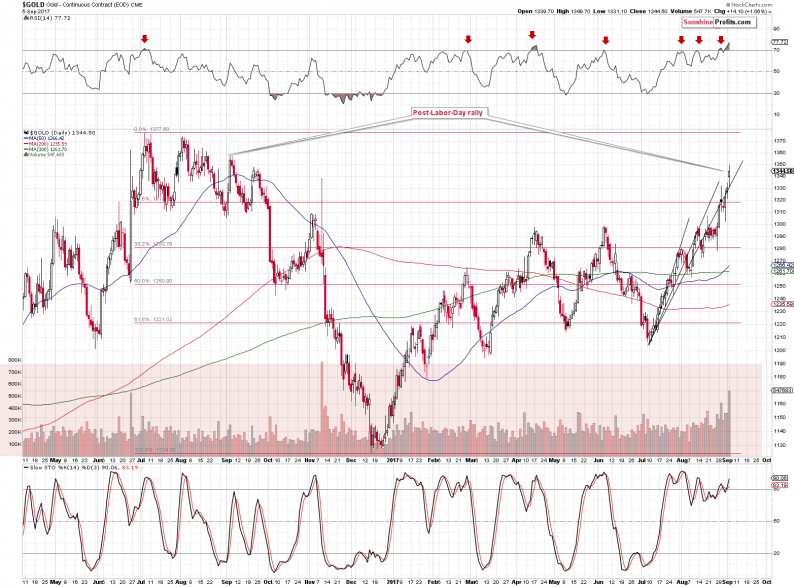
It was not so long ago, when we wrote about the record-breaking volume in gold. We described the implications of the extreme monthly volume and we discussed the very high readings in case of the individual sessions. We even described these sessions as the most important sessions of the year – at that time. Well, “at that time” those volume readings were indeed extreme, but what we saw yesterday made the previous sessions seem regular. The Tuesday’s volume in gold was the highest that we’ve seen ever (in case of daily upswings). The volume was even higher than the one that accompanied the results of the Brexit voting. With extreme volume, likely come extreme implications.
Let’s take a look at gold’s chart for details (charts courtesy of http://stockcharts.com).
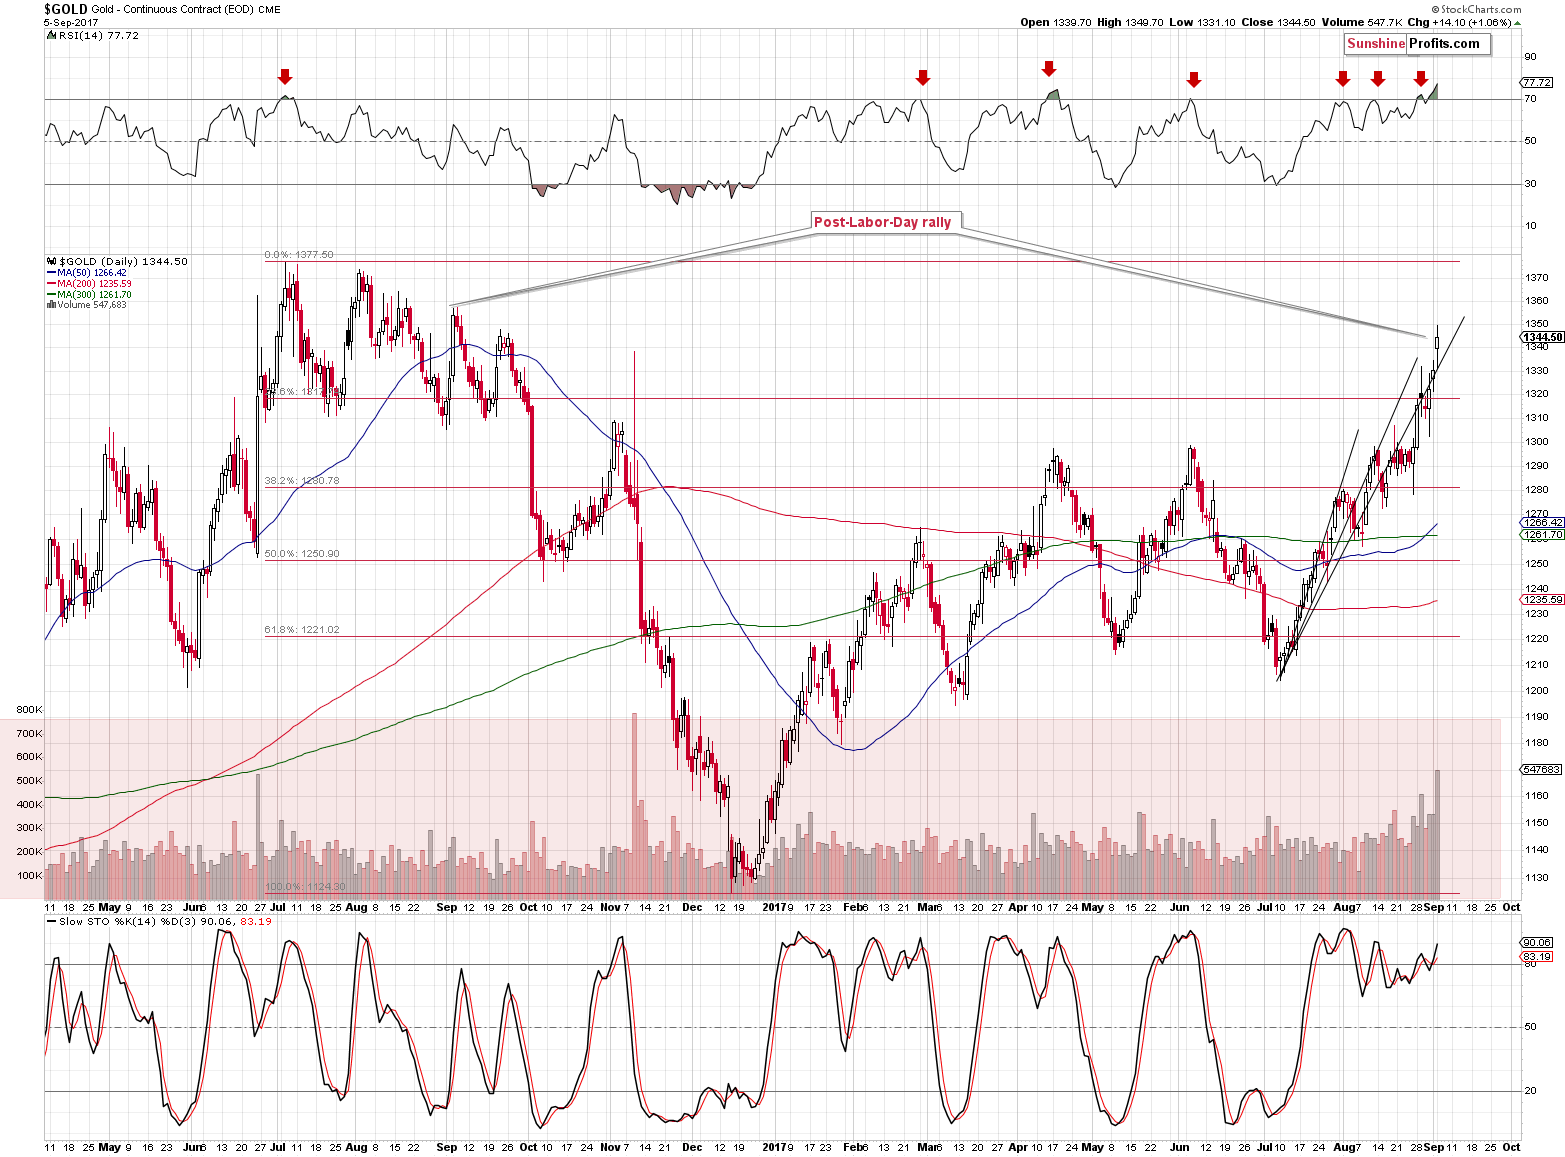
Gold is after a sizable rally, so at this point it would be natural to expect the huge volume to indicate a reversal. This, by itself, does not make it strong bearish factor, but taking into account the current time, does. Yesterday’s session was the first one after the Labor Day. In yesterday’s alert, we discussed the implications thereof in the following way:
The implications here are clearly bearish – almost always huge declines started either immediately or shortly after the Labor Day. This kind of efficiency alone is something that should make one considering opening the short positions in the precious metals market even without taking into account the situation in the USD Index.


Leave A Comment