
The “Trump trade” on/off dynamic continued to define gold price action. The metal rose while the US Dollar fell alongside US stocks and Treasury bond yields through about midday yesterday in what appeared to be follow-through from the prior session’s FOMC-inspired moves. A lull in top-tier event risk appeared to offer room for a correction thereafter, with an about-face reversal across the benchmark asset classes ultimately yielding near-flat results by day’s end. Crude oil prices mirrored this dynamic, initially finding support in a weaker greenback only to be stung by its recovery into the closing bell on Wall Street.
January’s US employment data takes center stage from here. Job creation is expected to see a modest pickup, but – as previously noted – this may be just enough to maintain the markets’ status-quo economic outlook without resolving worries about the impact of a still-uncertain fiscal policy. On the other hand, a downside surprise against the backdrop of already shaky market confidence threatens to reboot “Trump trade” unwinding in earnest, sinking the greenback and broadly boosting commodities.
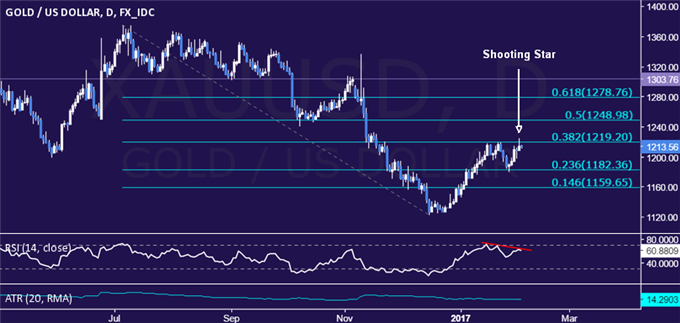
GOLD TECHNICAL ANALYSIS – Gold prices have erased all of last week’s losses but conspicuously failed to breach range resistance. Instead, a Shooting Star candle has appeared, pointing to indecision and hinting at a possible turn lower ahead. A break below initial support at 1182.36, the 23.6% Fibonacci retracement, exposes the 14.6% level at 1159.65. Alternatively, a daily close above the 38.2% Fib at 1219.20 opens the door for a test of the 50% retracement at 1248.98.
CRUDE OIL TECHNICAL ANALYSIS – Crude oil prices continue to mark time in a familiar range, with overall positioning still hinting at the formation of a Head and Shoulders top. A turn below support at 52.44 targets the 50.25-69 area (38.2% Fibonacci retracement, January 10 low), with a subsequent daily close below that confirming the bearish pattern and exposing the 50% level at 48.72. Alternatively, a breach above the 23.6% Fib expansion at 53.75 paves the way for a test of the 55.21-65 zone (January 3 high, 38.2% expansion).


Leave A Comment