
Fundamental Forecast for Gold: Neutral
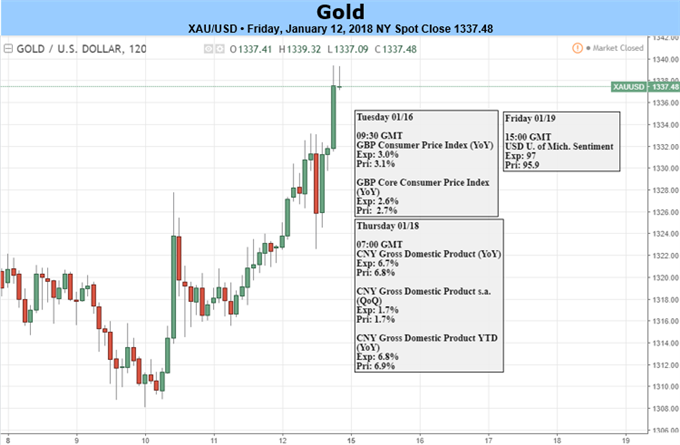
Gold prices are attempting to close out a fifth consecutive week of gains with the precious metal up nearly 0.4% to trade at 1324 heading into the New York open on Friday. The advance comes alongside continued strength in U.S. equity markets and crude prices and although further gains are likely, the immediate advance in gold looks vulnerable heading into next week.
It’s another quiet week for data with the release of the Federal Reserve’s Beige Book and the University of Michigan confidence surveys highlighting the economic docket. Keep in mind it’s a shortened holiday week with U.S equity and bond markets closed on Monday in observance of Martin Luther King Jr. Day.
The focus for gold is on the technical picture with the +7% advance off the December low now eyeing key technical resistance. Interestingly enough, a similar setup exists in oil prices and if the current interpretation is correct, we’ll be looking for a possible exhaustion trade early in the session.
Gold Daily
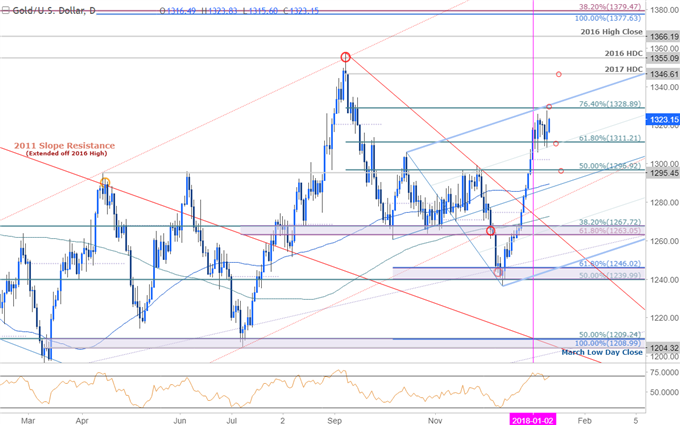
Gold prices broke above basic trendline resistance late-last month with the advance now targeting confluence resistance at 1329/30– this region is defined by the 76.4% retracement of the 2017 decline and the upper median-line parallel of the broader ascending pitchfork formation (blue) extending off the October low. Interim support rests at the 50-line which converges on the 61.8% retracement into the start of the week at1311.


Leave A Comment