In our Monday’s analysis, we emphasized that a lot changed from the short-term point of view, even though price changes in gold and silver were small. On Tuesday, we argued that closing our short position on Tuesday had been justified. Mining stocks soared by over 3% making yesterday’s session the biggest daily rally since August. A lot has changed indeed. Will the rally continue for much longer?
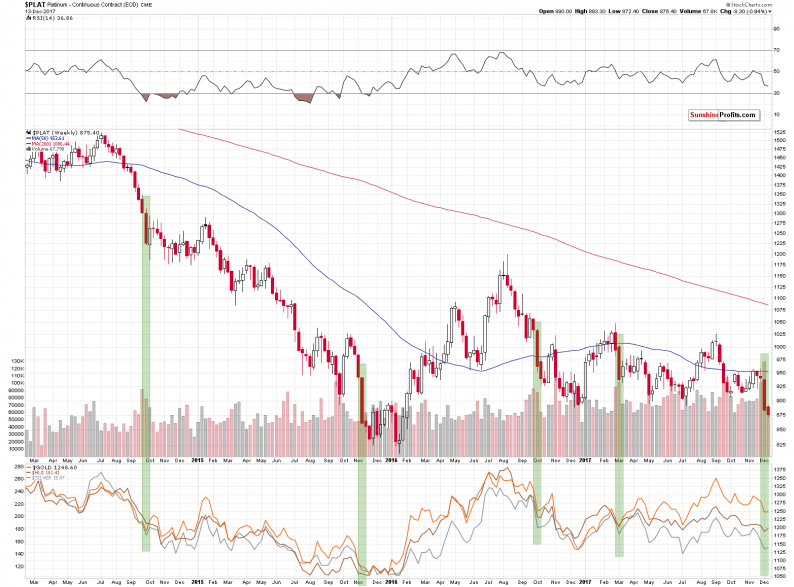
Let’s take a look at the chart to find out, starting with the chart that was the first to indicate that the decline is ending – platinum (charts courtesy of StockCharts).

On Monday, we wrote the following based on the previous week’s price changes in platinum:
As odd as it may sound, whenever platinum declined in a very profound way (about 5% in a week), it meant that either a corrective upswing was about to start in the following week (2014, 2016) or that a decline had just ended (2015, March 2017). We’ve seen this phenomenon 4 times in the recent years and in each case, it had bullish implications. 4 out of 4, meaning 100% efficiency is not something that should be ignored.
Does it mean that the precious metals sector will soar immediately? No. The above chart is based on weekly candlesticks in the case of platinum and weekly closing prices in the case of gold, silver and the HUI Index that are visible in the lower part of the above chart. Consequently, whatever implications the above chart has, they are in terms of the next week’s closing prices. So, gold, silver and mining stock are likely to end the next week higher, but not necessarily rally in its first part.
We previously mentioned that the Fed interest rate decision day could mark a turning point or we could see the interim bottom very close to it. The above chart supports this outlook and it suggests that we should be prepared to either exit the short positions or to switch to long ones. We are considering both options and which decision we take will depend on the confirmations that we get in the meantime.


Leave A Comment