
Calendar Trend Indicates Bullish 4 Month SPX Time Period Upcoming
The old market axiom says ‘Sell in May and go away’ — meaning avoid the volatile summer months and return to larger allocations in November.
With the end of October (and Halloween) upon us, we took a look at the recent market performance in November and the months following. There definitely has been a trend in place for the past 6 years (since the infamous ‘666’ SPX market panic bottom in 2009) that active investors and traders should be aware of.

The 4 month period of November through February have been nicely bullish in the past 6 years.
Here’s the data for the S&P 500 Index (SPX) (SPY) over the past 6 years:
SPX Performance Table, November to February ‘Halloween Move’
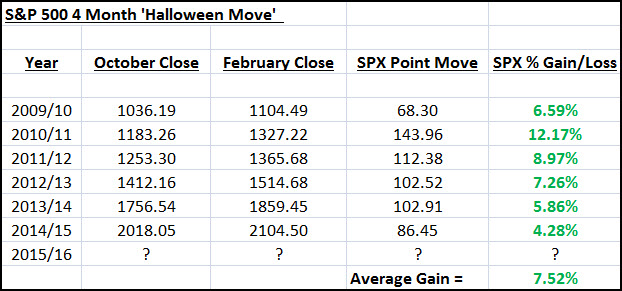
An average 7.7% gain for the market in that 4 month time period is impressive, as is the 100% success rate (5 of 5 times). However, the amount of the gain has lessened each year since 2010/2011, keep that in mind.
Here’s a visual view that shows the 4 month SPX move and encompasses the market crisis time period:
SPX Monthly Chart
Click on image to enlarge
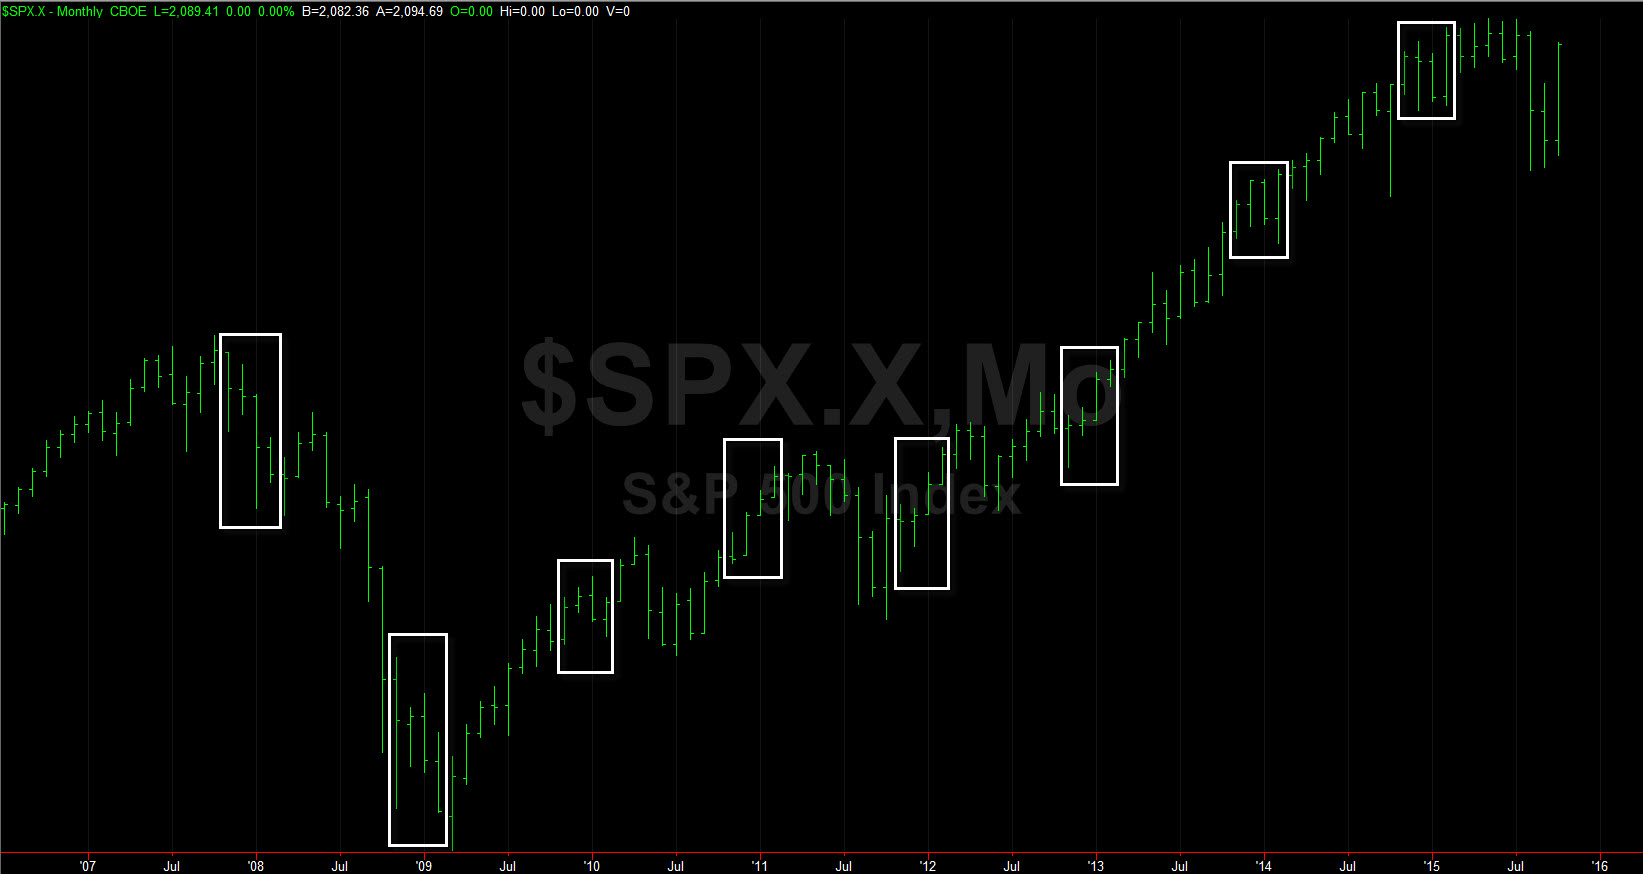
Chart created with TradeStation
You can see that this 4 month time period wasn’t strong in 2007/2008 and ’08/’09 – that was during the buildup and acceleration of the global financial crisis and meltdown — so if we avoid another large economic or market setback, we look well-poised for some nice gains in the coming months.


Leave A Comment