
Having seen the FTSE 100 fall over 200 points from its June 2nd highs, the index breaking decisively lower today is setting the scene for this selloff to roll on.
However, with several interior resistance levels remaining in play, how far is the index is set to fall? See below, for Faraday Research’s view on this point.
Head and Shoulders
The index breaking below the ascending neckline of a well-established ‘head and shoulder’ pattern last month is key. This reversal pattern confirms the bearish backdrop for the index and provides the foundation for any FTSE 100 short.
Of course, we must stress that the index remains in a longer-term uptrend. Accordingly, the potential for a sharp reversal in short-term (bearish) momentum remains very real. As such, it is critical that investors look for signs that this could be on the cards and how prices trade at key interior support levels offers exactly that.
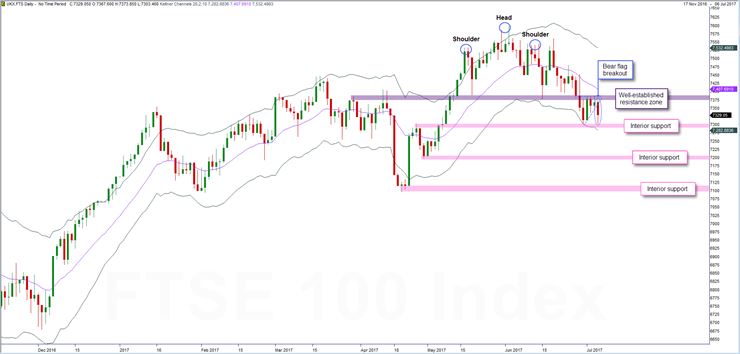
FTSE 100 9 Month Daily Candle Chart
Today’s break lower
As the above chart highlights, an interior resistance zone is in play between 7,389 and 7,373. We note that intraday highs failing to break above this level 4 times in as many days has seen this resistance level unequivocally re-affirmed this week.
With a resistance level formed overhead, the FTSE 100’s move into an aggressive compression mode last week grabbed our attention. Whilst the index has printed a series of higher lows to form a ‘bear flag’, this week’s battle between bulls and bears is best depicted by Tuesday’s and Wednesday’s price action. Tuesday’s range was the narrowest in 4 sessions, yesterday’s range the narrowest in 7 sessions and the combined 2 day range the narrowest in 20.
So where next?
Given today’s bearish break lower, the probability favours the index going onto break below the next interior support level. Although prices have (so far) failed to do so and, in fact, bounced off this level intraday, our short-term outlook for the index remains bearish. Hence, we highlight the subsequent support levels below this. Of course, prices rarely move in a straight line and we caveat these levels by stating that key pivot levels can (and do) change as prices evolve over time.


Leave A Comment