
Watch out for emergencies. They are your big chance.
Fritz Reiner
On the 31st of Jan, we wrote:
After trading as low as $27.56 oil reversed course and headed higher, it is now in a transition phase; moving from a down trending phase to a bottoming phase. Oil did not close below $30 on a monthly basis, so the outlook has not changed. The current bottom has all the signs of a fake bottom, meaning that it is probably a setup for the early bulls. Oil is likely to test its lows once again before a bottom takes hold. A bottom could take hold in the month of February. Oil, however, cannot close below $30 on a monthly basis, if it does, then the bottoming process could be delayed. Market Update Jan 31, 2016
Oil bottomed out in February and, more importantly, it did not close below $30.00 on a monthly basis. Going forward for the outlook to remain positive, the same rule applies. Oil can trade below $30.00, and this will have no impact on the longer term outlook as long as it does not close below this level on a monthly basis. We are going look at oil in three different time frames and you will note that in all three, $30.00 represents an important price point, and this is why oil should not close below this level on a monthly basis, as former support will turn into resistance.
Oil price 5-month chart 2016
We can clearly see on the 5-month chart that oil should not close below 30.00 on a monthly basis. In the short time frames, oil is slightly overbought so after a possible test of the 35.00 ranges, oil could drop down to the 26.50-28.00 ranges before trending higher. This sudden reversal is a set up to knock the early bulls out and full the bears that the market is going to crash.
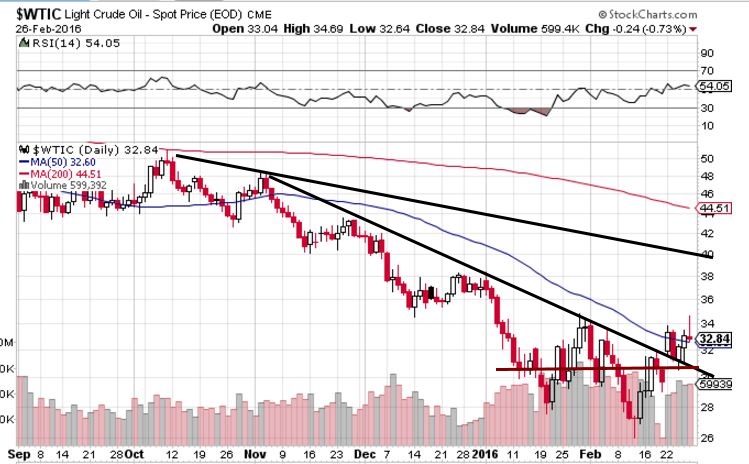
Oil prices one year chart

Key price points to focus on the one year chart. A weekly close above 35.00 will lead to a fast move to the 40.50-42.00 ranges, before pulling back.
Oil Prices five-year chart


Leave A Comment