
Much attention has been paid of late to the building of diversified portfolios to smooth out performance through the reduction of meaningful drawdown. This analysis looks at asset allocation and the importance of understanding the correlations of portfolio assets in arriving at more effective diversification for investors. Freepik Particular attention is paid to the relationship of fixed income as a diversifier in equity bear markets and the circumstances where its diversification value may erode.Correlation volatility as expressed by the range of correlation is presented as an indicator to predict portfolio performance under stress. While some investment practitioners may also look at Beta and Covariance as important portfolio tools, this paper focuses on the fundamental factor of correlation as it is the driving force of directional offset. The analysis shows the benefit of incorporating consistent negative correlation exposure into the equity component of portfolios as an alternative to using fixed income to improve diversification during stressed markets. This approach appears to be a more consistent diversifier than fixed income. Specific attention is paid to the credit sector’s tendency to fluctuate in correlation to equities as well. Equity volatility under stress can be extremely disruptive. This analysis considers the value of systematic dedicated and stable negative correlation hedging within the equity sleeve of allocation in contrast to solely relying on the less stable negative correlation of the fixed income portion of the fixed income allocation. Suggestions for defensive equity allocations within a diversified portfolio are considered.
Asset Allocation and Portfolio Diversification:Will expected portfolio returns look like the past?For the past 68 years advisors have been turning to Professor Markowitz’ Modern Portfolio Theory to reduce risk and improve the quality of investor portfolio returns. The important takeaway for investors is that blending the right assets in the optimal way can improve the risk and return of a blended portfolio over less diversified portfolios. Originally known as the theory of portfolio choice, the approach takes into account the forecast returns, volatility, and correlations of assets to arrive at optimal portfolios.Less than 60 years ago work derived from Professor William Sharpe’s Capital Asset Pricing Model postulated that the return of an asset should be related to its risk. Expression of market risk often combines volatility of returns, forecasted returns, and correlation history to determine the best mix of assets. In order to manage the overall risk of disappointing their clients, advisors and managers have focused on keeping absolute and relative volatility low to improve the relationship between return and risk. Given the SEC disclaimer that past returns (and we extend it to correlations) are not indicative of future performance in making investment decisions, it is no surprise that actual experienced portfolio returns do not resemble the smooth forecasts provided to clients. Obviously, it is difficult to predict returns on individual stocks or the market in general. Another major issue is human behavior. Investors tend to panic sell at market bottoms and panic buy at market tops. This might not be the case if investors had faith in their diversification methodology and its soundness.For investors it is asset class correlations that matter:Volatility is the speed, but correlations are the road mapThere has been much focus by advisors on managing overall portfolio volatility for their clients to eliminate the bumpiness of the performance ride. The thought that throttling down volatility alone may limit losses is inadequate and may be misleading to investors. A more important factor in asset allocation may be understanding both the stability and consistency of asset correlations in portfolios.This is particularly true during stress events. While some investment practitioners may also look at Beta and Covariance as important portfolio tools, this paper focuses on the fundamental factor of correlation as it is the driving force of diversification. To reduce the risk of major drawdown, correlation is more important than forecasting the volatility of the markets or the asset classes perfectly. If volatility is incorrectly forecasted but correlations remain stable, there should be an offsetting asset that diversifies the volatility effectively. In essence, volatility is the speed of the car on a trip, but the asset correlations are the road map that guides the driver. If correlations (or the relationships between asset classes or funds) do not remain stable, a portfolio we think is diversified may actually perform very differently than projected. This is the dilemma of diversification under stress. This effect has been noted by many in the asset allocation world and has led to an almost uniform rejection of the static 60/40 rule for asset allocation. Investor portfolios tend to correlate much more than we expect under stress and that can cost portfolios tremendous value over time. So, while Modern Portfolio Theory and efficient portfolios are valuable planning tools, they rely significantly on forecasts and the assumption of the stability of correlations. If the timing of returns is important to an investor (near retirement or later in life expectancy) or if significant risk is taken in a part of the portfolio (such as equity or lower quality credit funds) it needs to be hedged with less risky assets. We believe looking for consistently low or negatively correlated assets can prove to be very valuable, particularly in stressed markets. What we will look at in this analysis is the stability and range of major asset correlations to the S&P 500 with a focus on fixed income and credit sectors. Many investors have been using this approach as a primary source of income and diversification against their equity holdings. If an asset or asset class has a wide range of correlation potential, it by definition, provides a wider range of hedged outcomes versus a negative equity market. If an asset has a tighter range of correlation potential, the hedged outcomes should be more predictable.Fixed income sectors correlations versus the S&P:A picture is worth a thousand wordsFixed income has historically served two purposes in portfolios over the years. First, fixed income provides income to live off without having to sell principal, and secondly, fixed income historically provides a hedge that performs defensively when the economy or equities, in general, struggle. But over the past decade, with interest rates being lowered to zero or near zero, the fixed-income class has performed better than expected, increasing investor allocation in portfolios. As yields on Treasuries dropped, more importantly, investors have increased their allocations to corporate credit and non-investment grade credit to chase higher yields. This has created both principal gains (as interest rates drop) and solid income for investors as corporate yields maintain a spread over treasuries. This additional return, however, comes at a cost of lost diversification and greater correlation to equities. In contrast, an option-based hedged equity approach systematically reduces correlation to equities as equities drop significantly. This should be a consideration when evaluating diversifying strategies. As seen in the chart below the hedge equity approach responds quickly to equity downdrafts while the various fixed-income sectors have been more inconsistent. Surprisingly, the range of correlation (to S&P 500) variability is actually quite high and is an important consideration when evaluating portfolio diversification. Chart 1. Long-term inter-asset trailing 3-month (60 trading days) correlations to S&P 500 since 2003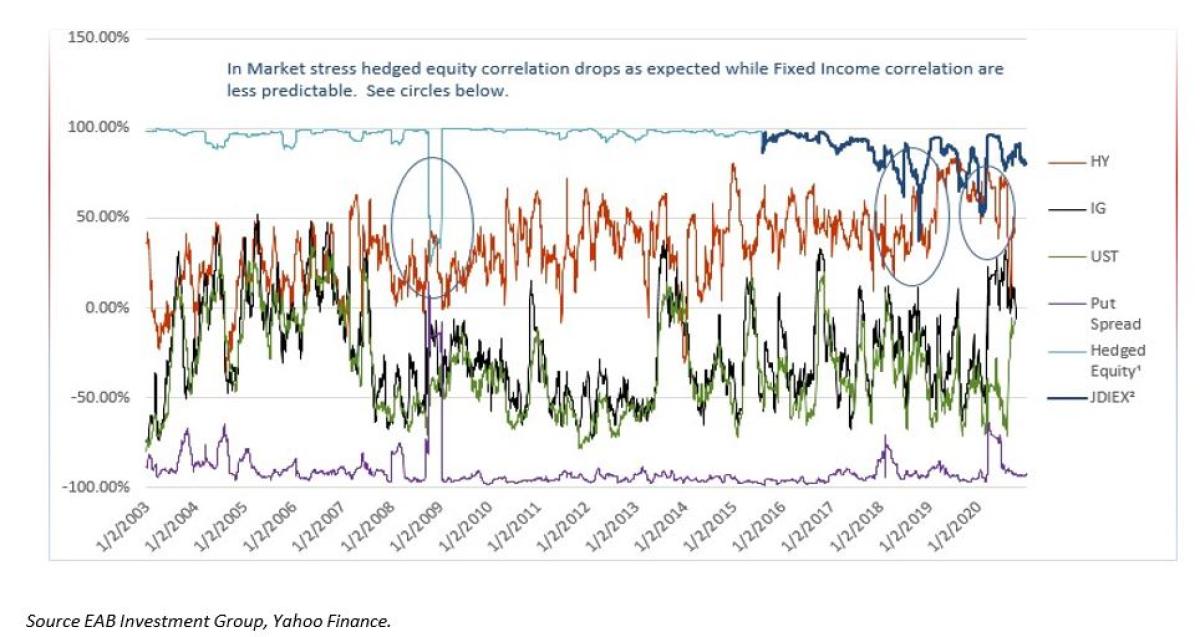 Contrary to popular belief and the assumptions of asset allocation models, the chart above illustrates that correlations are not particularly stable. Interestingly, the put strategy alone and the combination of the puts and the equity index (and JDIEX from its 8/31/2015 inception) were stable until the Lehman crisis, when the impact of the puts provided a reduction in correlation. In other words, the systematic use of options acts as a hedge to the equity portion of the portfolio. This diversification value stands in contrast to the other asset classes where correlations in some cases rose dramatically. Most notably (see circles), high yield moved from near zero levels in the weeks prior to the Lehman crisis to well over 40% trailing 3-month correlations in the months after. We see very similar behavior in the December 2018 and March 2020 periods. While it’s not the purpose of this document to forecast a crisis, it would seem to us that the holding of a fixed-income asset that has such a wide potential for correlation instability should be combined with a more diversified predictable hedge.“Relying on the averages (correlation) could have precarious impacts should equities struggle.”We theorize that correlation and the stability of correlation provide a better forecast of what could happen to a portfolio than a simple average or estimate of correlation. Looking at the data back to 2003, one can clearly see that investment corporate credit (the black line) and high yield (the red line), specifically show a very wide range of volatility, even turning significantly positive to equities periodically through history. High yield can possess a positive correlation to equity and has at times under times of stress. While average correlations could justify a significant allocation to high yield, it must be recognized that relying on the averages when stress correlations can have such a large effect could have precarious impacts should equities struggle.
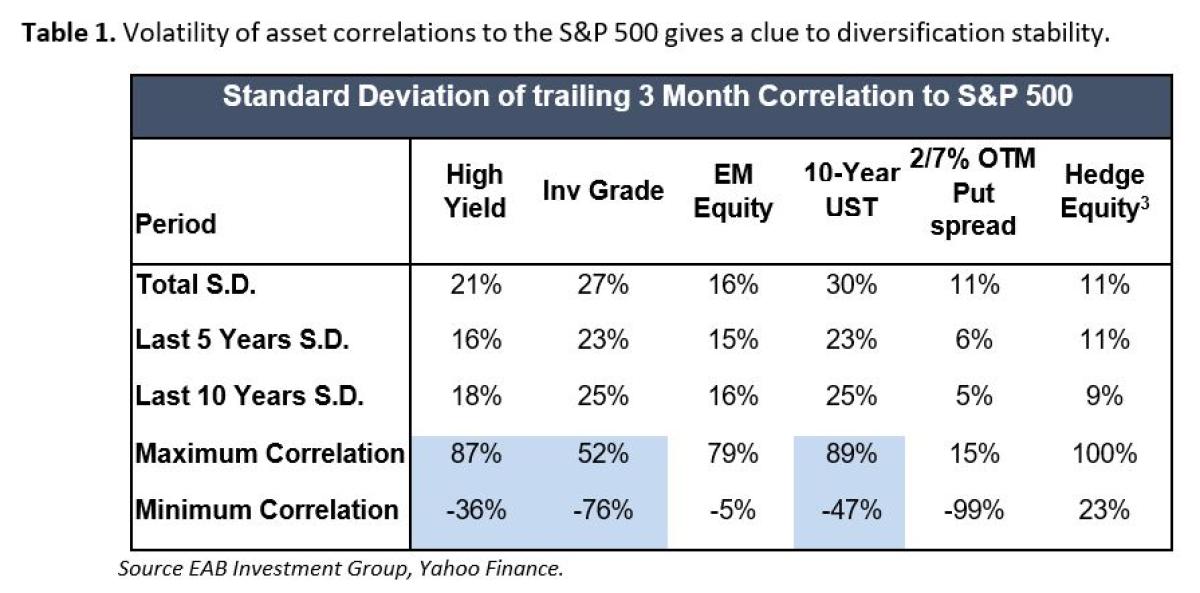 Another way to look at correlations is to calculate the actual range of the correlations versus their mean as an indicator of diversification stability. From Table 1, one can see that fixed income correlations have a relatively high range of correlation to equity. The US 10-year bond correlation, surprisingly led in volatility of correlation, but the investment and high-yield credit sectors also showed a much wider range of diversification effectiveness than perceived by practitioners. As can be clearly seen in the table, the S&P put strategy and the combined synthetic/ JDIEX strategy show a much tighter range of correlation, with the put strategy becoming less volatile over the past 5-year period.The benefits of disciplined continuous put buying create a level of negative correlation and diversification stability that is difficult to find in fixed income. For investors and advisors where the sequence of returns is critical and there is concern about the potential for powerful bear equity markets, we would consider careful attention to portfolio stress correlation potential. Clearly, any multi-asset class funds or risk parity-based strategies that assume correlation stability are also at risk of negative surprise as a result of correlation instability. While the concept can be applied to multiple asset classes, our sense is that the fixed income class should be a primary focus because of the extreme Central Bank stimulus provided and the potential that this stimulus may, albeit slowly, be withdrawn in the future.Fixed income and why coupon diversifies equity returns:If one looks at the data prior to the recent Central Bank Quantitative Easing (QE) period, there was a distinct benefit to holding a mix of stocks and bonds. Much of that benefit derived from the fact that medium-term US government bonds provided an income flow that moderated the impact of equity downdrafts in all but the most severe equity bear markets. In the 1980-2000 period with the 10-year US government bond rates averaging approximately 6%, the coupon yield of the bonds alone in a 40% bond allocation portfolio could offset 2.4% of any equity market loss (40% x 6% annual coupon). But since the “tech wreck” (2001) short interest rates have been dropped to near zero by the Fed and long rates have been cut in half by the significant demand for government bonds that QE has fostered. In today’s marketplace, the same allocation would only provide an approximate 0.4% offset (assume a 1% annual coupon x 40%). In addition, in today’s post-QE lower interest rate world, the outcome would need to take into account another factor connected to the relationship of interest rates to bond value called duration.As rates go lower, the average maturity and duration of a bond get longer as a greater proportion of its cash flows come at principal maturity. While the reduction in coupon is an obvious negative for diversification, another often overlooked risk is the impact of lower rates on bond volatility because of the impact on average life or duration of the bond or portfolio. The duration measures the sensitivity of the bond or portfolio to changes in interest rates. We will focus on interest rate hikes for this analysis because rates seem to have limited downside. What follows in Table 2 are hypothetical examples of what returns may look like at various levels of interest rate hikes to bonds and 60/40 portfolios.Table 2. The duration impact of low rates makes even government bonds more volatile.
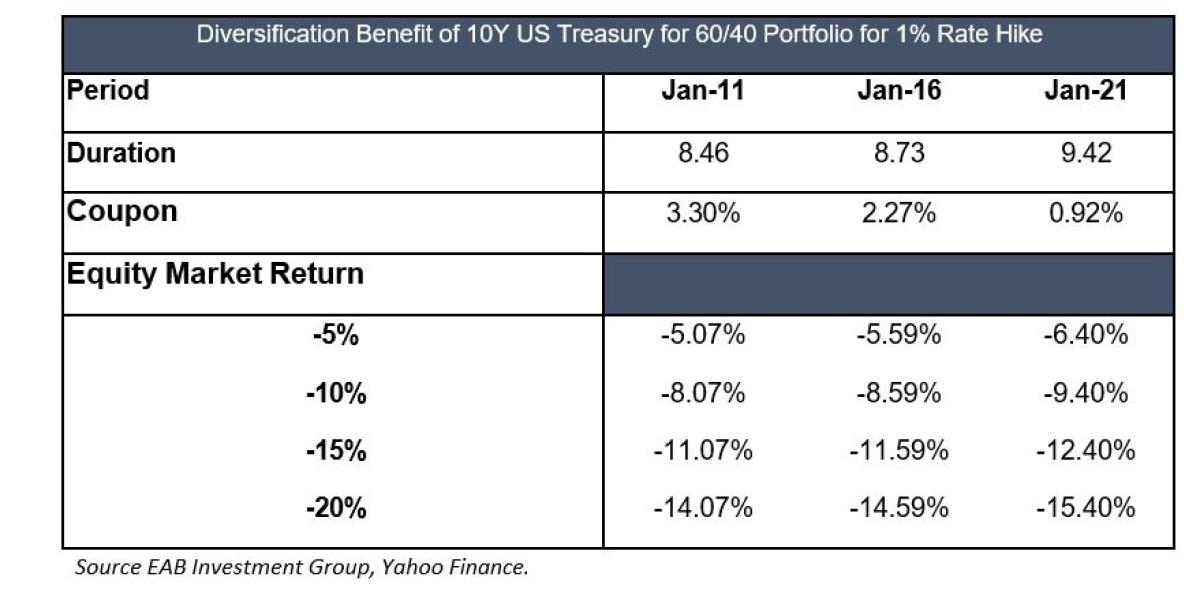
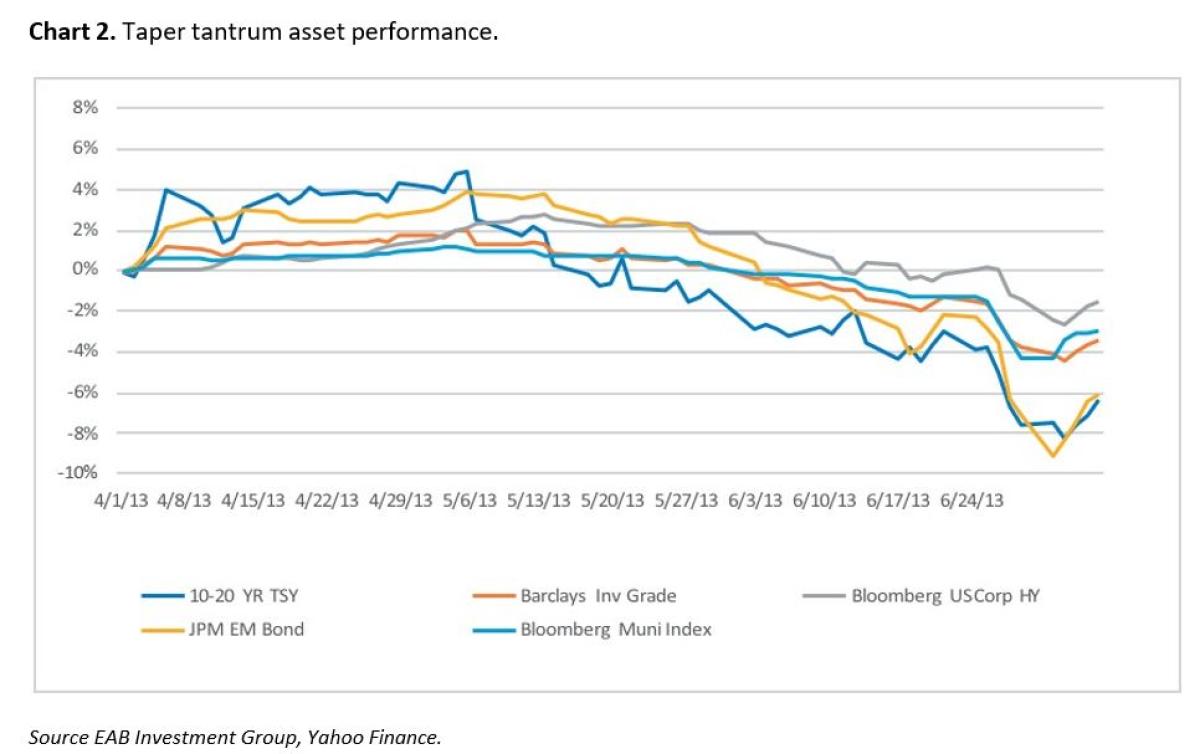 The Bloomberg chart above shows the performance of well-known bond indices. The extreme negative performance of fixed income occurred during these two months in 2013 on the threat of tapering as the Fed had not set in stone any commitment. The -6.38% loss for that period in corporate bonds (Barclays Investment Grade) and -9.81% for the 10-20-year Treasury led to negative annual returns for these fixed income categories for the year. While this is an anecdotal example, we think a true tapering process could potentially hurt holders of long bonds and credit strategies to a greater degree over a longer period of time. If an eventual equity downdraft were to occur, as they have historically later into a Fed hiking regime, credit-oriented portfolios could suffer twice as both fixed income and equities suffer. This relationship is clearly seen in the correlation data around the May 2013 correction. We think this example, while only one single observation, is intuitive and instructive for current investors concerned about diversification and drawdown limitation.Portfolio Defense, a timely allocation for equity and fixed income credit risk:For the purposes of this analysis, we will use a systematic out-of-the-money 2-month expiry put spread strategy as a defensive equity approach. When one analyzes the correlation of the 2-month S&P 500 2%- 7% out of the money (OTM) put spread performance correlation against the S&P, its steady negative correlation and its reduction of correlation to the S&P during stressed periods becomes obvious. Of course, this makes sense to the average investor as the puts are buying the rights to sell the S&P 500 itself at a designated price that could be higher than the market price at that time, generating a profit.Should the S&P not drop below that price, however, the cost of the puts would be lost. The combined equity index and put simulation shown above demonstrates that this type of put rebalancing and option strike price range offers an efficient manner in which to defend equity exposure. The JDIEX track record shows consistent performance within that expectation. The strategy still participates to some extent in equity returns should the markets be positively skewed. In major bear market moves, the hedged equity strategy has generally performed better than the lower-rated credit funds which become unstable in their correlations to equity as shown in the chart above. When combined with an equity index the puts provide a less correlated alternative to equities under stress than low-quality credit approaches do, thus more predictability. While this hedged equity approach would pay a low dividend annually, part of which helps fund the cost of the put strategy, its appeal is its consistent negative correlation of returns under extreme stressed equity markets. As one examines the return stream of the puts approach, the stability of its correlation is evident as is its value under stress. By combining the underlying index with the put approach, which can often be a cost (similar to insurance) a new return stream is generated that has some of the characteristics of equity and some of the defensive characteristics an investor wants in stress markets. This alternative, in our view, warrants an allocation of investor portfolios to hedge both lower-quality credit risk and equity risk.While we have presented some of the weaknesses of Modern Portfolio Theory optimizations with regard to correlation estimates, if one were to look at the post-QE environment to construct an efficient portfolio, the Hedged Equity approaches would still garner allocations. Using traditional techniques, our models consider a range of 18%-20% to be a reasonable allocation for moderate to aggressive investors but higher for conservative investors who need to generate total returns higher than current market coupons allow. It’s important to note that the last several years have been relatively favorable for diversification as interest rates have been dropped to near-zero levels. We believe at current low coupons it is only prudent to forecast much less effective fixed income diversification and forecast resulting higher fixed income volatility. Given these current conditions it would seem investor use of hedged equity would improve overall diversification significantly.As a result, we feel confident in our baseline consideration for investors who are particularly concerned about volatility spikes, or extreme equity market events, potentially higher allocations to hedged equity may be justified. For the aggressive investor, we would recommend the allocation would mostly come from the equity allocation and for the conservative investor, a greater proportion would come from the credit portion of the portfolio. One special case to evaluate is income-only investors that use no equity at the moment. For these investors where the correlation to equities may be hidden in increased credit exposure, the lower correlation hedge equity could be an appropriate way to improve diversification.About the Study:While the study is based on data and its analysis, the approach taken and communicated is not meant to be a quantitative treatise. Certainly, the math upon which the study rests can be presented but is not necessary for the conclusions drawn. The daily data in this study goes back to January of 2003, which we believe is a significant enough time period for the conclusions drawn. For the purposes of evaluating the hedged equity approach we combined the synthetic strategy with the JDIEX strategy from its inception 8/31/2015. The team also evaluated various trailing correlation periods, in particular trailing 3-month and trailing 6-month correlations. We found negligible difference between the behavior of 3- and 6-month correlations (data available upon request) which display similar paths and ranges of correlation.We chose the 90-day period because this more closely represents the frequency of market participant rebalancing and the tendency of the market to process downdrafts within a fairly compressed period of time. We also find trailing 3-month rolling correlations smooth out very short-term changes but are reflective of the real experience investors face throughout the life of their portfolios. The data was sourced from publicly available and reliable sites on Bloomberg, Yahoo Finance, and EAB Investment Group. There can be no guarantee, as with all simulations, and studies that these results will exactly mirror those experienced in these strategies going forward. The simulations are based on indices (with the exception of JDIEX the fund EAB manages as subadvisor) and, as such do not include fees and expenses investors might experience in actual funds. The analysis on the various hypothetical fixed-income performance scenarios is based on financially accepted modeling techniques and is for illustration only and not meant to represent actual returns or a forecast of actual fixed-income returns. Definitions:Alpha: The excess return of the fund relative to the return of the benchmark index is a fund’s alpha.Beta: A measure of the volatility, or systematic risk, of a security or a portfolio in comparison to the market as a whole. Beta is used in the capital asset pricing model (CAPM), a model that calculates the expected return of an asset based on its beta and expected market returns.Covariance: Covariance is a measure of the directional relationship between the returns on two risky assetsModern Portfolio Theory (MPT): A theory on how risk-averse investors can construct portfolios to optimize or maximize expected return based on a given level of market risk, emphasizing that risk is an inherent part of higher reward.Put: An option contract giving the owner the right, but not the obligation, to sell a specified amount of an underlying asset at a set price within a specified time. The buyer of a put option estimates that the underlying asset will drop below the exercise price before the expiration date.Quantitative Easing (QE): An unconventional monetary policy in which a central bank purchases government securities or other securities from the market in order to lower interest rates and increase money supply.S&P 500 Index: An index of 500 stocks chosen for market size, liquidity and industry grouping, among other factors. The S&P 500 is designed to be a leading indicator of U.S. equities and is meant to reflect the risk/return characteristics of the large cap universe.Standard Deviation: Measures historic volatility and is the measure of the dispersion of a set of data from its mean. The more volatile the data, the higher the deviation.Synthetic Options: A combination of stocks and/or options that return the same payoff characteristics of another options strategy. If the market begins to move against a cash or futures position it is losing money in real time. With the protective option in place, the hope is that the option will move up in value at the same speed to cover the losses. This is best accomplished with an at-the-money option but they are more expensive than an out-of-the-money option. In turn, this can have an adverse effect on the amount of capital committed to a trade. Even with an at-the-money option protecting against losses, the trader must have a money management strategy to determine when to get out of the cash or futures position. Without a plan to limit losses, he or she can miss an opportunity to switch a losing synthetic position to a profitable one. Also, if the market has little to no activity, the at-the-money option can begin to lose value due to time decay.Footnotes:1. Hedge Equity is the synthetic back test of the current JDIEX strategy2. JDIEX based on live mutual fund performance.3. Hedge Equity data set included both the synthetic strategy and live JDIEX performanceMore By This Author:Was 60/40 A Big Head Fake?The Short On Shorting Bonds Discover Uncommon Value In The Preferred And Capital Securities Market


Leave A Comment