Talk about sheep being led to the slaughter. The S&P 500 is up 11% from its February 11th intra-day low (1812) because Wall Street still has inventory to unload. That much is par for the course.
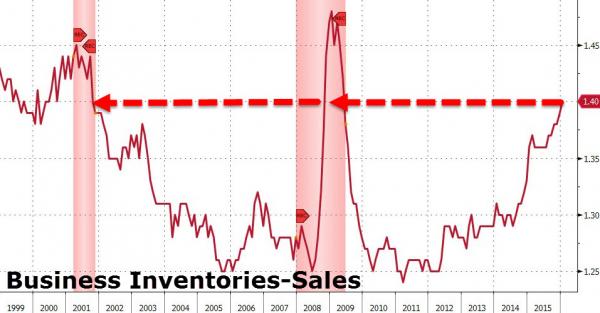
Yet the signs of an impending macroeconomic and profits implosion are now so overwhelming that it is truly remarkable that there are any bids left in the casino at all. This morning’s release of business sales for January, for example, showed another down month and that the inventory-to-sales ratio for the entire economy is now at 1.40X—a ratio last recorded in May 2009.
As Zero Hedge so aptly put it:
“Look at this chart!”

Once upon a time, real economists, investors and traders knew that business sales, wages and profits are the heart of the matter. No longer. The self-referential sentiment surveys, financial conditions indices and bullish spin on Fed word clouds which animate today’s casino muffle the fundamentals almost entirely.
Yesterday on Bloomberg TV, for example, my downbeat view was challenged with a chart showing that Goldman’s financial conditions index had perked up during the last 5-weeks. Where, I was asked, is the recession?
How about the quarter century of history shown below? Business sales reported this morning were down by 5.1% from their July 2014 cyclical peak. Self-evidently, declines of that magnitude have occurred only twice since 1992, and both of them bear the shaded imprint of recession.
The chart also bears something else. Namely, real economic meat and potatoes. Even at their slumping January level, business sales came in at a $15.5 annual trillion rate. That’s something; it measures the entire churn of manufacturing, wholesale and retail sales from coast-to-coast.
It trumps monthly purchasing manager sentiment surveys—often filled out by secretaries; and also such flickering signals as short-run fluctuations in credit spreads—always banged around by the trading herd. And by a long shot.
Likewise, there is not much doubt that wages are slumping, too. And we are talking here about the actual wages paid by millions of employers who remit payroll taxes to the US Treasury. The latter reports its results daily; and its collections are self-evidently at stall speed already.
The four-week moving average is now just barely 2% above last year, meaning that after accounting for the 2% trend growth in wage inflation, there is no growth in hours worked at all. Nor is there any doubt that the trend is heading resolutely from the upper right to the lower left!
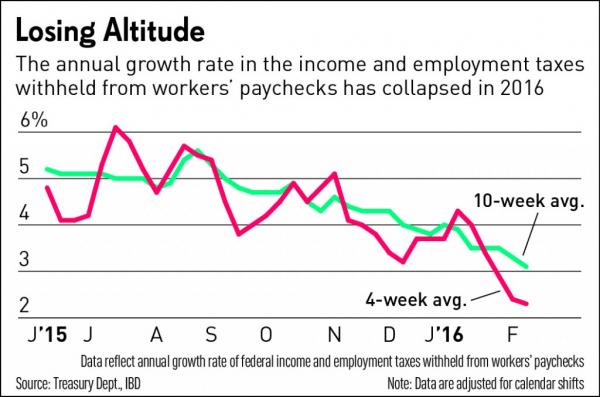
Needless to say, the number of employers who send in withholding taxes for seasonally adjusted phantom employees is somewhere between zero and none. Nor does the IRS even hear from companies who might have died or could have been born.
Indeed, the BLS’ clunky modeling fantasies should have been repudiated long ago by the chart below.
As of May 2008, the Great Recession was already six months old, but Wall Street was still unloading its inventory. And all the while, the same talking heads who have given the all-clear sign in the last 5 weeks were on bubblevision gumming about Goldilocks, no recession in sight and stability on the jobs front.


Leave A Comment