
With today’s release of the September S&P/Case-Shiller Home Price Index, we learned that seasonally adjusted home prices for the benchmark 20-city index were up 0.5% month over month. The seasonally adjusted national index year-over-year change has hovered between 4.2% and 6.2% for the last thirty months. Today’s S&P/Case-Shiller National Home Price Index (nominal) reached another new high.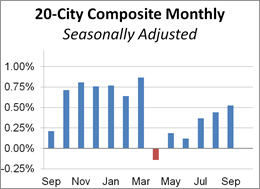
The adjacent column chart illustrates the month-over-month change in the seasonally adjusted 20-city index, which tends to be the most closely watched of the Case-Shiller series. It was up 0.5% from the previous month. The nonseasonally adjusted index was up 5.9% year-over-year.
Investing.com had forecast a 0.4% MoM seasonally adjusted increase and 6.1% YoY nonseasonally adjusted for the 20-city series.
Here is an excerpt of the analysis from today’s Standard & Poor’s press release.
“Home prices continued to rise across the country with the S&P CoreLogic Case-Shiller National Index rising at the fastest annual rate since June 2014,” says David M. Blitzer, Managing Director and Chairman of the Index Committee at S&P Dow Jones Indices. “Home prices were higher in all 20 cities tracked by these indices compared to a year earlier; 16 cities saw annual price increases accelerate from last month. Strength continues to be concentrated in the west with Seattle, Las Vegas, San Diego and Portland seeing the largest gains. The smallest increases were in Atlanta, New York, Miami, Chicago and Washington. Eight cities have surpassed their pre-financial crisis peaks.” [Link to source]
The chart below is an overlay of the Case-Shiller 10- and 20-City Composite Indexes along with the national index since 1987, the first year that the 10-City Composite was tracked. Note that the 20-City, which is probably the most closely watched of the three, dates from 2000. We’ve used the seasonally adjusted data for this illustration.


Leave A Comment