
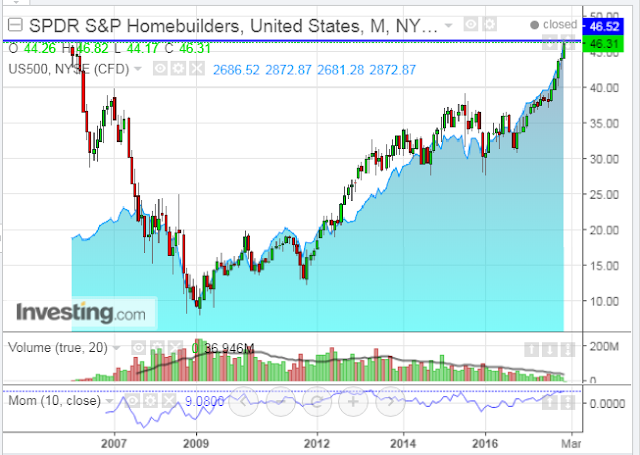
The Homebuilders ETF (XHB) is poised to make a new all-time high as it faces its peak set just before the 2007/08 financial crisis struck, as shown on the monthly chart below.
There are two interesting things I notice on this chart. The volume moving average has been steadily declining since September of 2013 as the momentum indicator is nearing its record peak set in May of 2013…hinting of potential profit-taking at current overheated levels.
So, whether or not we are about to see a rollover anytime soon should be revealed in coming days/weeks. Keep an eye on volumes and momentum, for possible clues.
The S&P 500 Index (SPX) is shown in the background as the blue area. If the XHB rolls over, it may also bring the SPX with it, but, as I described in yesterday’s post, keep an eye on HYG, as well.


Leave A Comment