One of the most heated debates on whether the bull market has run its course is about household wealth. The bearish investors claim that since household wealth as a percentage of GDP is at a record, the cycle must end, while the bullish investors disagree because there is no specific wealth cap in relation to GDP. A similar discussion is had in relation to incomes as the net worth to income ratio is also at a record high. This is caused by demographics skewing older, the near record long expansion, and the record long bull market. Older people have more wealth because they have had more years to earn and build savings than younger people.
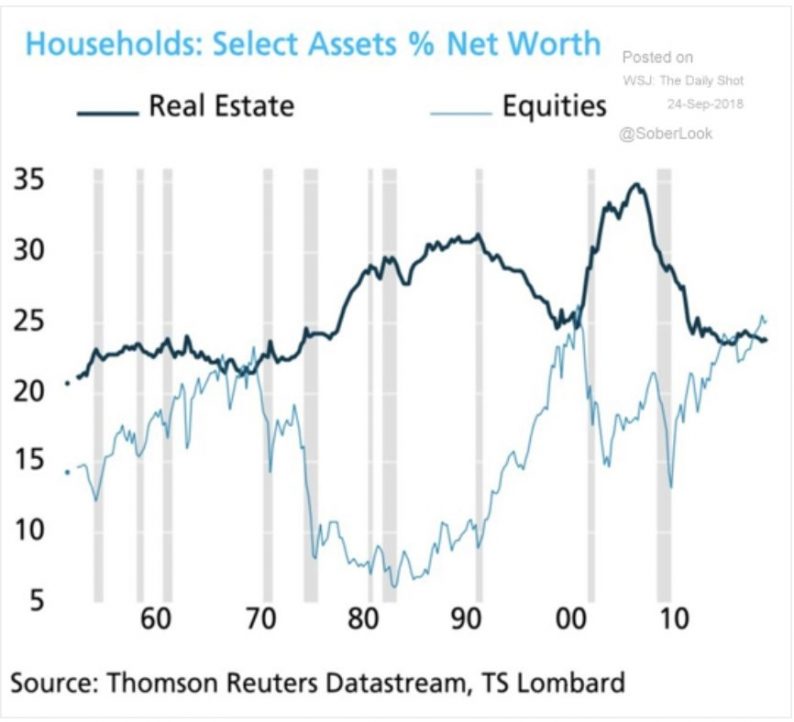
The Daily Shot chart below shows stocks have catalyzed the increase in household wealth.
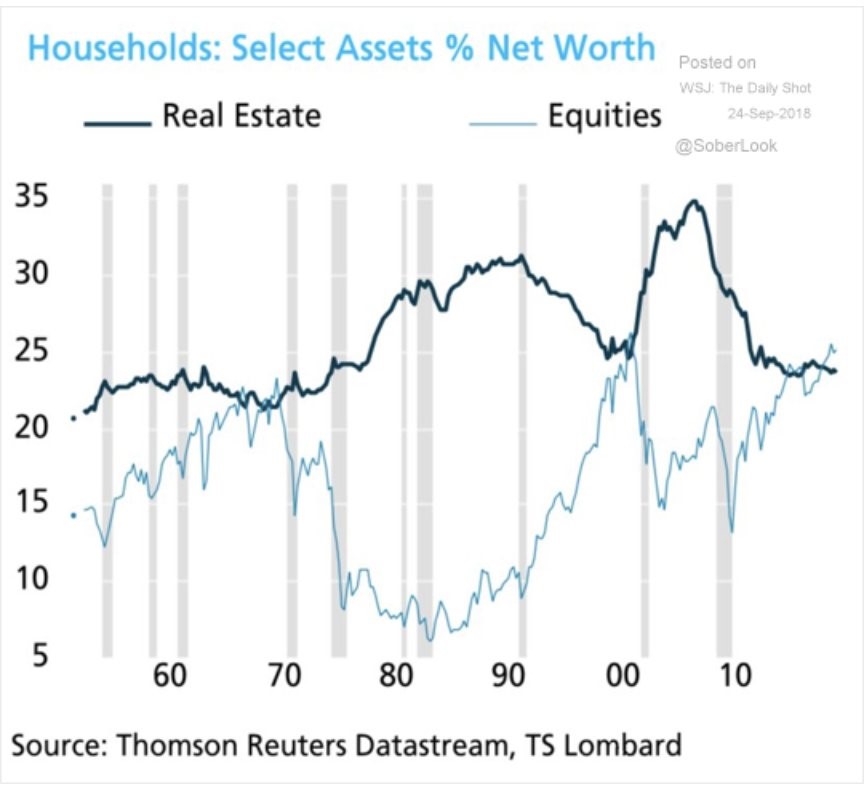
Source: chart
Comparing household wealth to GDP is a variation of comparing stocks to GDP which we already know is wrong because of increased international earnings. There is inverse relationship because all the assets households own can only get to 100%. Stocks were a small part of household wealth in the 1980s while real estate increased in value. Real estate declined in the 1990s while the tech bubble exploded. We’re once again in a position where stocks are doing well while real estate isn’t a historically large part of household wealth. Stocks are near their 2000 peak and above the late 1970s peak. Ultimately, earnings growth and this expansion will determine stock prices, but this chart is food for thought for both bulls and bears.
Is Housing Affordable?
Even though real estate is a historically low portion of wealth, that doesn’t mean it has been doing terribly because household wealth is extraordinary. We’ve previously discussed how this is an interesting period because consumers think the economy is in a great position to buy a house, but buying conditions are the worst since 2008 because of how expensive housing has become.
Housing has been one of the leaders in CPI as it has driven inflation during this cycle. Rising interest rates add to the increased cost of home ownership. This explains why we’ve seen weakness in the housing market this summer. The August seasonally adjusted existing home sales fell 1.5% year over year in July and August. Median sales prices for existing homes fell 1.7% month over month to $264,000, but they increased 4.7% year over year.


Leave A Comment