
The last Housing Market Review covered data reported in March, 2017 for February, 2017. At that time, the iShares US Home Construction (ITB) was at the bottom of what turned out to be a very shallow pullback from a near 10-year high. The subsequent recovery has been grinding and slow, but ITB now trades above where it was at the last rate hike from the Federal Reserve. The bullish breakout for the S&P 500 (SPY) in the past week translated into minimal gains for ITB.
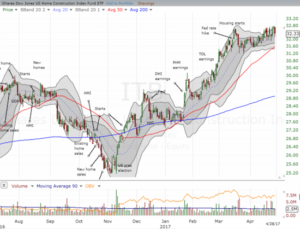
The iShares US Home Construction (ITB) has spent over a month SLOWLY churning out a recovery from the last dip. This slow-motion action COULD form a solid base for a fresh rally.
Source: FreeStockCharts.com
In general, the housing data once again looked strong. However with the Spring selling season in full gear, I am not surprised to see momentum in ITB slow to a crawl. The market tends to price in most of the positive lift from the Spring selling season months in advance. An upgrade of Toll Brothers on April 11th seemed to breath new life into ITB and extend the momentum of the seasonally strong period. However, ITB trades just fractionally higher than that point, and TOL trades a bit below that point now. Per my rule, I almost sold TOL once it closed the gap, but a successful test of support at its 50-day moving average (DMA) gave me fresh encouragement yet again.
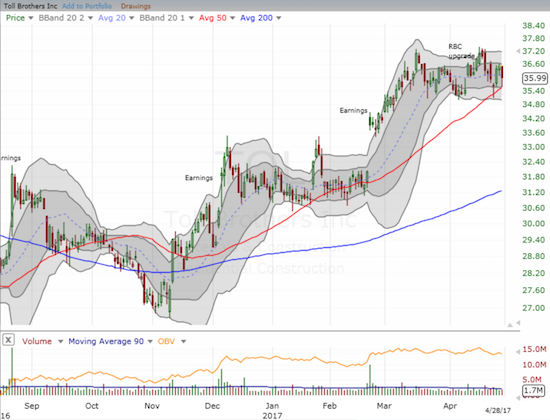
Toll Brothers (TOL) is in a 7-week long period of consolidation that is now bumping up against critical, uptrending 50DMA support.
New Residential Construction (Housing Starts) – March, 2017
Single-family housing starts for February were revised upward from 872,000 to 895,000. March starts dropped month-over-month by 6.2% to 821,000. This change did not break the on-going uptrend. On an annual basis, single-family housing starts gained 9.3% which was below the year-over-year increases of 11.1% in January and 13.5% in February.

The solid uptrend in housing starts continued in March although momentum may be slowing a bit.
Source: US. Bureau of the Census, Privately Owned Housing Starts: 1-Unit Structures [HOUST1F], retrieved from FRED, Federal Reserve Bank of St. Louis, April 23, 2017.
Across the regions, starts varied widely. The Northeast took the #1 spot with a 19.0% gain. The South jumped a healthy 14.5%. The West continued its gains with a 6.2% increase. The Midwest was a notable laggard with a drop of 8.6%.
Existing Home Sales – March, 2017
For January, existing home sales returned to gains and hit levels not seen since February, 2007. For February, existing home sales dropped sharply from the previous month’s post-recession high and served up a reminder of the month-to-month volatility in this series. For March, existing home sales made a sharp rebound and set a new post-recession high (the highest in over 10 years). Right on cue, the National Association of Realtors (NAR) sounded a bit more upbeat than it did after reporting on the sharp month-over-month drop in sales in February…
“The early returns so far this spring buying season look very promising as a rising number of households dipped their toes into the market and were successfully able to close on a home last month…Although finding available properties to buy continues to be a strenuous task for many buyers, there was enough of a monthly increase in listings in March for sales to muster a strong gain. Sales will go up as long as inventory does…
Bolstered by strong consumer confidence and underlying demand, home sales are up convincingly from a year ago nationally and in all four major regions despite the fact that buying a home has gotten more expensive over the past year.”
The seasonally adjusted annualized sales of 5.71M were up 4.4% month-over-month from a downwardly revised 5.47M (from 5.48M) in sales for February. Year-over-year sales increased a healthy 5.9% (compare to November’s 15.4% year-over-year pop, December’s 0.7% increase, January’s 3.8% rise, and February’s 5.4% increase). February sales dropped to levels last seen September, 2016 while March sales jumped to levels last seen February, 2007. A continued trend higher from here would be very significant for confirming the underlying strength of existing home sales.
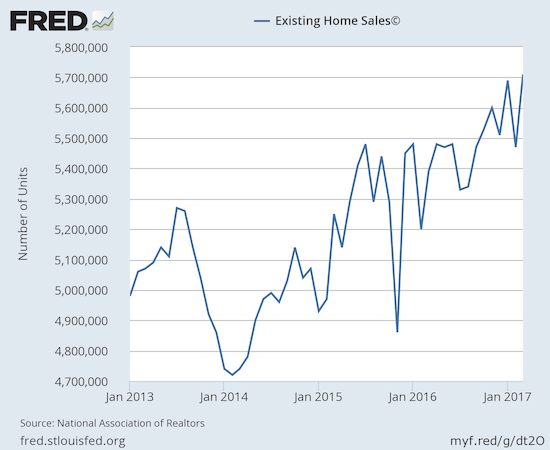
Month-to-month volatility is partially distracting from the very strong overall uptrend for existing home sales.(recall that the NAR no longer makes data available before 2013. For more historical data to 1999 click here)
Source: National Association of Realtors, Existing Home Sales© [EXHOSLUSM495S], retrieved from FRED, Federal Reserve Bank of St. Louis, April 23, 2017.
Putting aside the NAR’s swings with the monthly volatility in the data, the main headline for existing sales remains that they have consistently trended upward despite all the reported and now well-known headwinds. The jump in sales in January demonstrated the strength in the housing market despite scarce inventory and the resulting increase in prices. The monthly decline in February did not erase that strength, especially considering year-over-year sales were up. The resurgent sales in March confirms the strength. First-time buyers are also still hanging in there. In March, first-timers were 32% of sales, same as in February, down just one percentage point from December and January, and up two percentage points from a year ago. The average for 2016 was 35%.


Leave A Comment