I saw a flicker of hope for home builders in the May Housing Market Review. Traders decided to snuff that flicker out very quickly afterward. When I wrote June’s housing market review and described a “struggling flicker,” the iShares US Home Construction ETF (ITB) was once again bouncing off the bottom of 2018’s trading range. Almost like a cycle, a month later the July Housing Market Review came just as ITB tested the bottom of the range once again. Since then, ITB recorded a fresh 2018 and 10-month low in a pattern that has driven a large divergence with the S&P 500 (SPY): ITB is down 13.7% year-to-date while the S&P 500 is just off its all-time high with an 8.5% year-to-date gain.

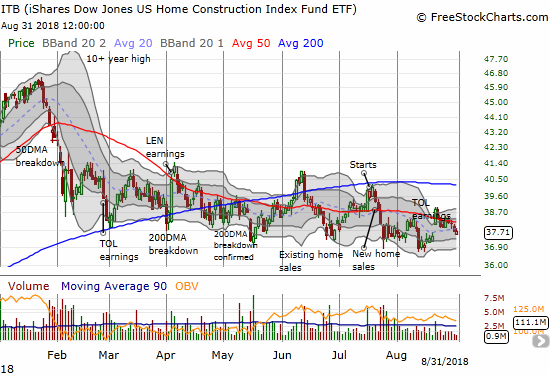
Source: FreeStockCharts.com
The iShares US Home Construction ETF (ITB) almost looks like it will stay stuck in a declining trading range for the remainder of the year.
Soon after that new low, ITB experienced a jolt from a (surprisingly) positively received earnings report from Toll Brothers (TOL). Unfortunately, existing homes sales data the next day immediately cooled off the enthusiasm. TOL and ITB, in general, is still struggling to recover that brief upward momentum.
New Residential Construction (Single-Family Housing Starts) – July 2018
While housing starts surged in May and left no doubt that home builders were confident as ever, the subsequent plunge in housing starts in June appeared to temper that enthusiastic interpretation. A small increase in July seems to have stabilized things for now.
Single-family housing starts for June were revised slightly downward from 858,000 to 854,000, ending three straight months of significant upward revisions. July starts increased month-over-month by 0.9% to 862,000, barely off the lowest level of the year. On an annual basis, single-family housing starts increased 2.7%. This small increase erases the previous month’s first year-over-year decline since August 2016.
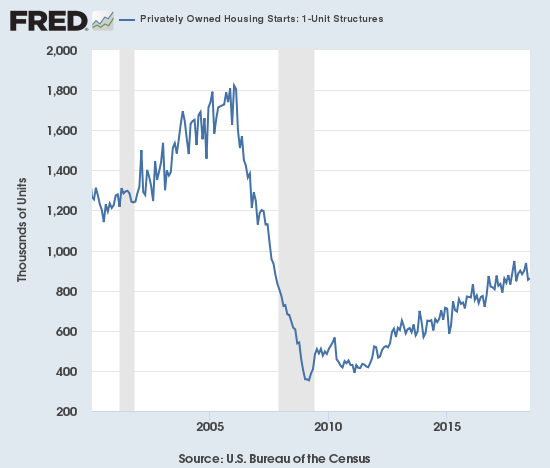
Source: US. Bureau of the Census, Privately Owned Housing Starts: 1-Unit Structures [HOUST1F], retrieved from FRED, Federal Reserve Bank of St. Louis, September 2018.
Housing starts are precariously bouncing along the extended uptrend from the housing bottom.
Over the 8 months prior to May, regional year-over-year changes in starts exhibited wide dispersion. For May, housing starts were very strong across the board. For June, the Midwest stood out as a large loser. For July, the wide dispersion returned. The Northeast, Midwest, South, and West each changed -2.9%, 18.1%, -0.4%, 3.1% respectively. In other words, the headline bump up in starts was largely driven by the strong bounce-back in the Midwest and is not quite as good as it looks on the surface.
Existing Home Sales – July 2018
A fourth straight month-over-month decline and a fifth straight month of year-over-year declines in sales for existing homes helped confirm the dampened mood for the stocks of home builders. The news was bad enough to begin a sharp erosion of enthusiasm over earnings from Toll Brothers (TOL) the day before.
The February existing sales numbers ended a 2-month sales decline and softened a bit my alarm bells. In March, monthly sales continued to increase, but the year-over-year change was a decrease. For April, both monthly and year-over-year changes were declines. May recorded similar declines and put existing home sales right back in “yellow” cautionary territory. June and July’s double whammies of monthly and annual declines put existing home sales in “red” territory.
The seasonally adjusted annualized sales in July of 5.34M were down 0.7% month-over-month from 5.38M in sales for June (unrevised). Year-over-year sales decreased 1.5% and once again stayed consistent with the trend of decelerating existing home sales.
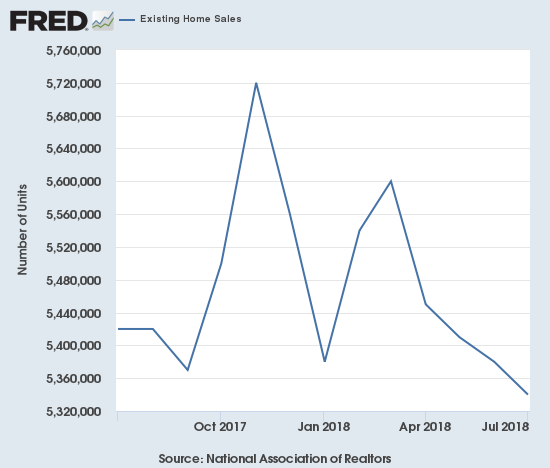
Source for chart: National Association of Realtors, Existing Home Sales© [EXHOSLUSM495S], retrieved from FRED, Federal Reserve Bank of St. Louis, September 2, 2018.
Existing home sales over the last year have taken on a toppy pattern.
(As of the March 2018 data, the NAR further reduced historical data to just 13 months. For historical data from 1999 to 2014, click here. For historical data from 2014 to 2018, click here)


Leave A Comment