
I’ve really been impressed by the start that we have seen here in 2018.
Really an amazing start, and the best opening week that I can remember having to a new year, in a very, very long time. In fact it is the best opening week for the stock market since 2006.
Following December where the volume was simply putrid and the market was uninterested, this has been a much welcomed rally.
But the big question is, can it last?
Of late, the big sectors that are rallying are Basic Materials and Energy. Financials tried, but have stumbled since yesterday’s attempt to get off the starting blocks. Technology is finally running again, after not existing during the month of December, and then you have Consumer Cyclical which is benefiting from a huge Christmas spending spree. All of this bullishness has led to a phenomenal start to the year, compounded by an unbelievable 2017.
The big issue that I am seeing this week and with this market, is the breadth. Despite the broad based bullishness among the sectors I’ve mentioned, and throughout the indices, the stocks don’t seem to all be rallying together.
Take the T2108 for starters which measures the percentage of stocks trading above their 40-day moving average.
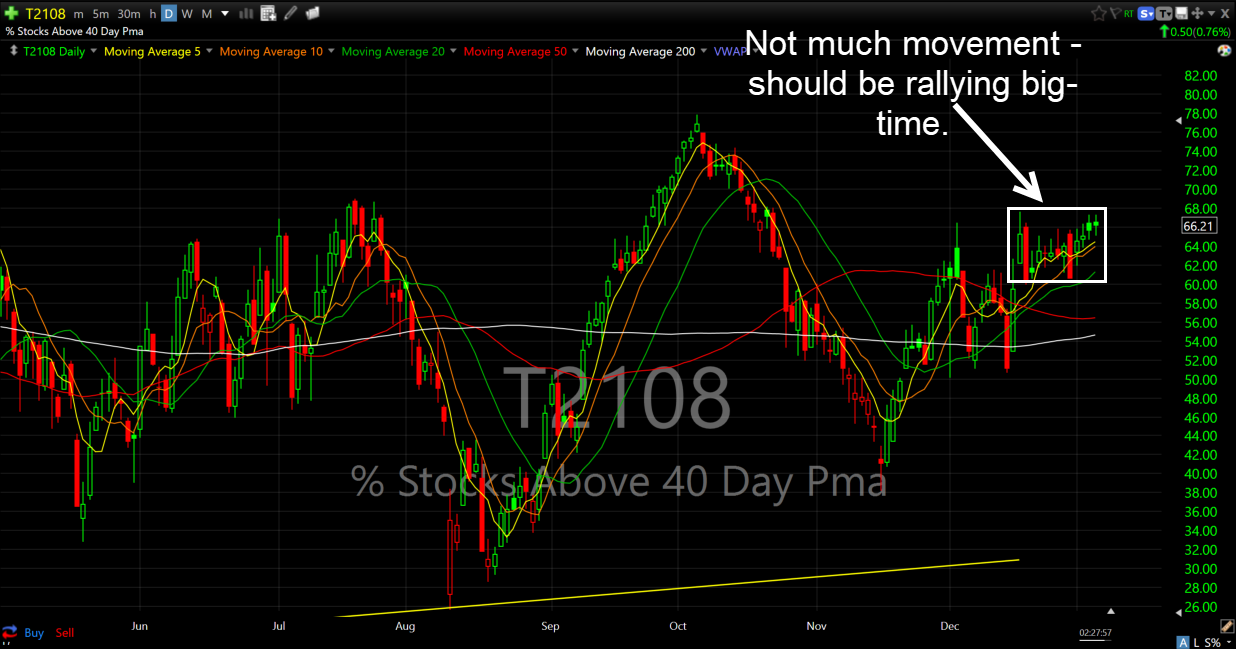
As you can see, the percentage of stocks trading above their 40-day moving average hasn’t been improving at all. That is a huge concern for stocks, because with a market as bullish as the one we are seeing here, should be seeing a reading of 75-80%, if not more.
Now take the number of stocks that are advancing versus declining on the NYSE:
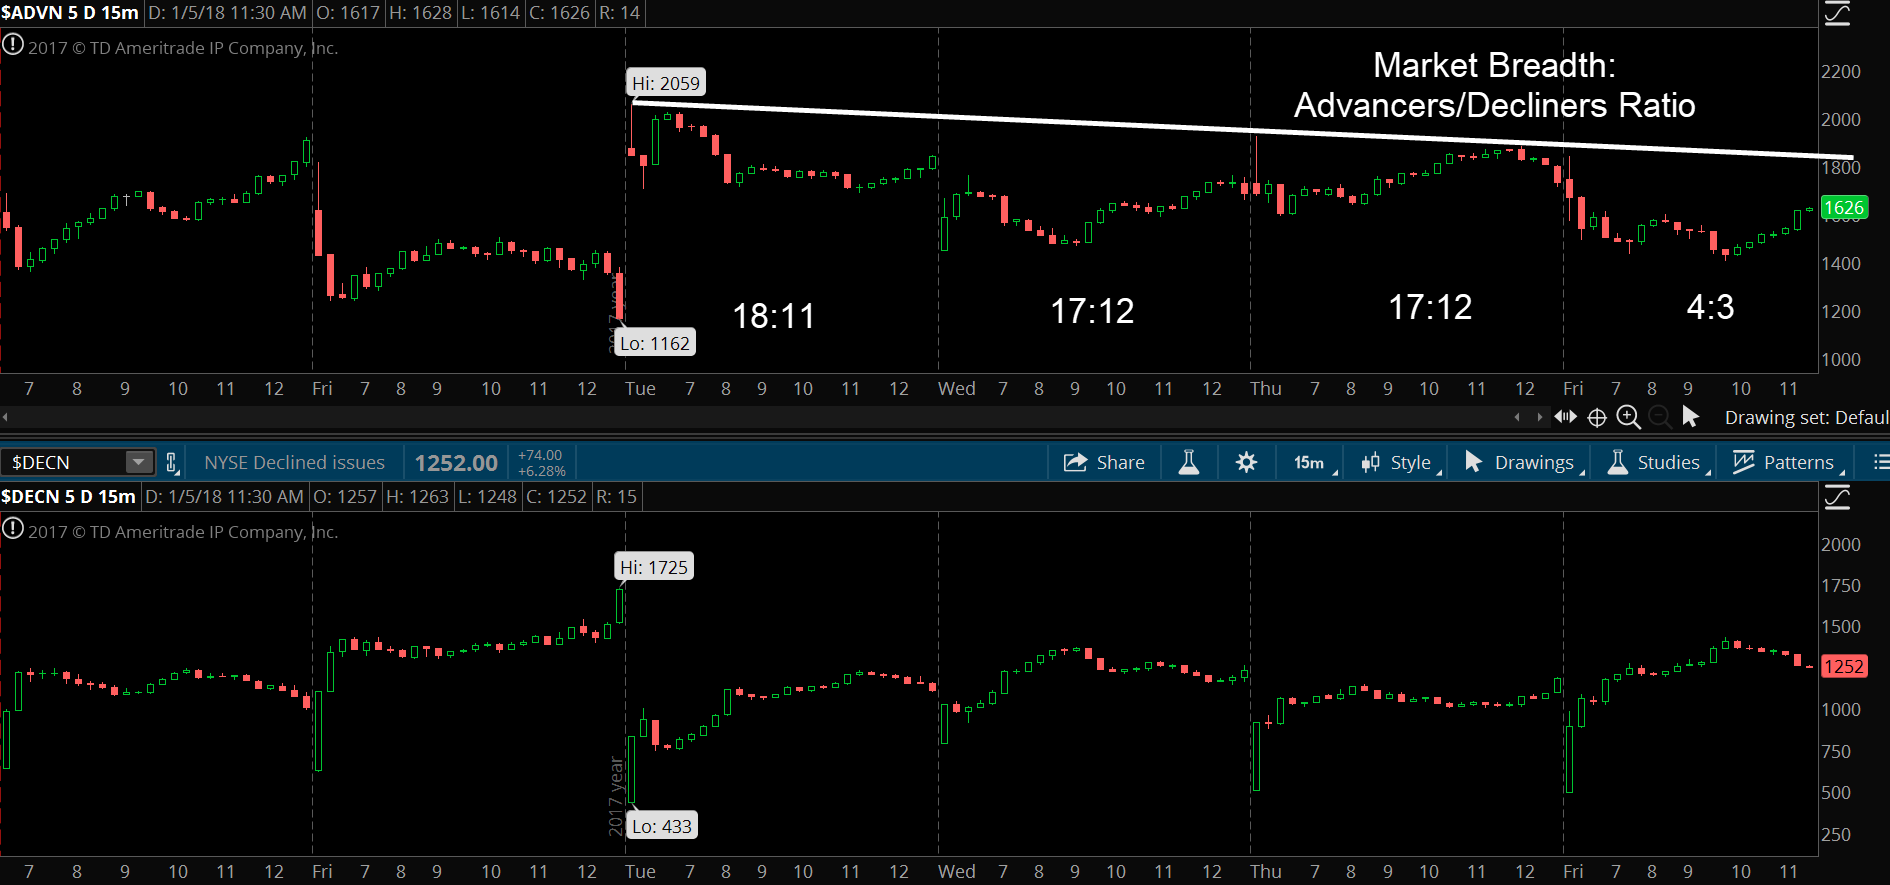
This is also known as the market’s breadth, how many stocks on the NYSE are rallying versus how many of those are tiring. This is one of the most sure fire ways to spot notable divergences in the market, and as you can see here, there is some diverging going on. The breadth isn’t improving, in fact, it has been worsening each and every day.


Leave A Comment