
As is usually the case, the stock market broke, but initial claims are still at record levels. This is how it has historically works as bubbles start to deflate. Employers are the last to get the news. But the very fact of their record long term ebullience was warning enough, as I have repeatedly chronicled here over the past year. For now, though they still haven’t gotten the message, and that means that things are likely to get much worse until the real cuts come and hit deep.
Actual initial unemployment claims counted by the 50 states totaled 230,493 last week, which is another record low for this calendar week. It continues a nearly uninterrupted string of record lows that began in September 2013. We have been able to see and track this trend because we focus on the trend of the actual data instead of the seasonally manipulated headline number expectations game favored by Wall Street and its Big Media subsidiaries. Facts tend to be more useful than the economic establishment’s favored fictitious numbers.
The Department of Labor (DoL) reports the unmanipulated numbers that state unemployment offices actually count and report each week. This week it said, “The advance number of actual initial claims under state programs, unadjusted, totaled 230,493 in the week ending August 29, an increase of 3,844 (or 1.7 percent) from the previous week. The seasonal factors had expected a decrease of 5,409 (or -2.4 percent) from the previous week. There were 249,780 initial claims in the comparable week in 2014. ” Below is a 10 year chart of the actual data.
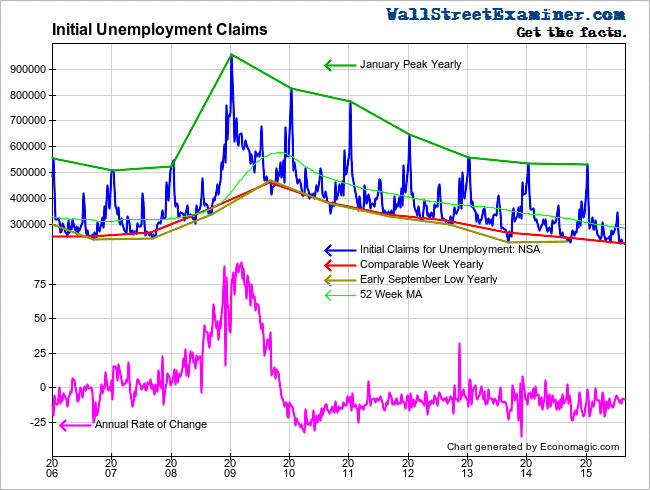
Initial Claims and Annual Rate of Change
You can see for yourself from the chart just how extraordinarily low the recent numbers have been.
When using actual data we want to see if there’s any evidence of trend change. Thus we look at how the current week compares with this week in prior years and whether there’s any sign of change in the trend. The actual change for the current week was an increase of 3,400 (rounded). This week of August is a swing week, sometimes with an increase in claims and sometimes with a decrease. The 10 year average for the week was a decrease of +1,300, but excluding 2008 when the economy was tanking the average would have been slightly positive. This year was unremarkable in that context but showed a hint of weakness versus 2014 (+800) and was significantly worse then 2013 (-10,200), which was the best performance of the past 10 years.


Leave A Comment