Last week, the RBA lowered Australian interest rates 25 basis points, to 1.75%. The press release contained the following paragraph:
Inflation has been quite low for some time and recent data were unexpectedly low. While the quarterly data contain some temporary factors, these results, together with ongoing very subdued growth in labor costs and very low cost pressures elsewhere in the world, point to a lower outlook for inflation than previously forecast.
The paragraph provides ample fodder for analysts’ belief that low inflation was the primary reason for the cut. After all, the topic sentence describes inflation as “unexpectedly low.” While the next sentence concedes temporary factors are at least partially responsible, it also discusses a wider range of disinflationary pressures, including weak labor cost growth and low global inflation.
But is dis-inflation really a growing problem? The data isn’t as conclusive:

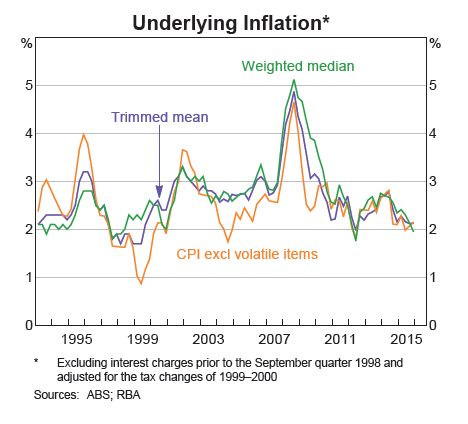
The above graph plots three CPI measures: trimmed mean, weighted mean and CPI excluding volatile items. All three are near 2% — hardly a panic level.
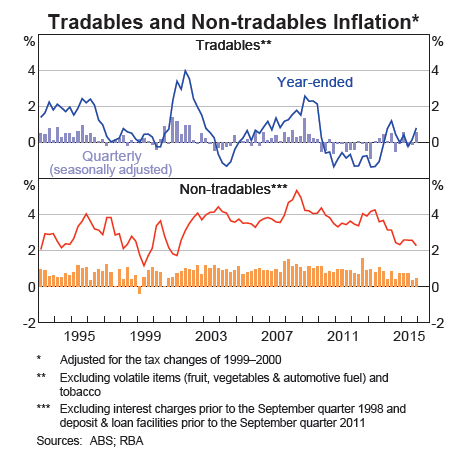
Tradables inflation (top chart, blue line) is weak but rose from negative levels several years ago. And non-tradables inflation (lower chart, red line) is slightly above 2% — again, a comfortable level for inflation.
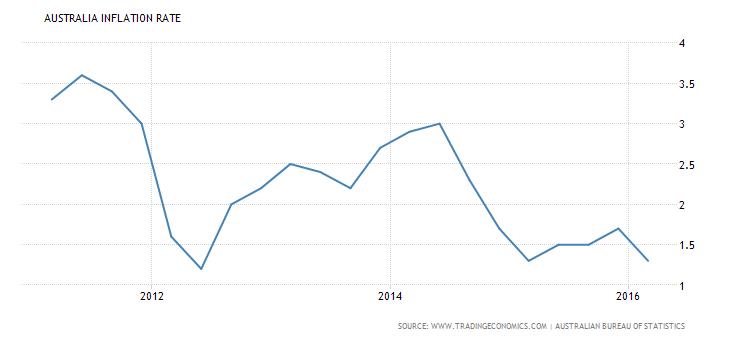
And while overall inflation recently dipped below 2%, it’s a new development. And its past behavior indicates a return to over 2% is likely.
Other economic numbers are strong, arguing against a rate cut. GDP growth fluctuated between 2%-3% for the last 5 quarters. After peaking at 6.4% at the beginning of 2015, unemployment has steadily declined to its current 5.7% level. The wealth effect, where an increase in asset prices leads to increased spending, is clearly supporting household expenditures:
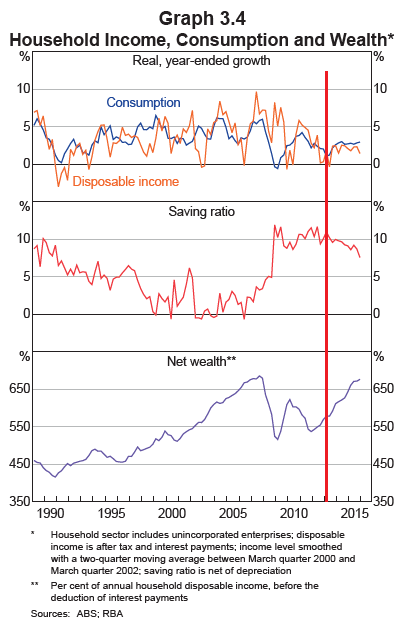
Overall wealth (bottom chart) increased steadily for the last 4 years, supporting a solid 2-2.5% growth rate in consumption (top chart, blue line). This has increased slightly faster than disposable income (top chart, gold line) forcing households to liquidate some of their savings (middle chart). But at slightly less than 10%, there are ample savings for households to spend.


Leave A Comment