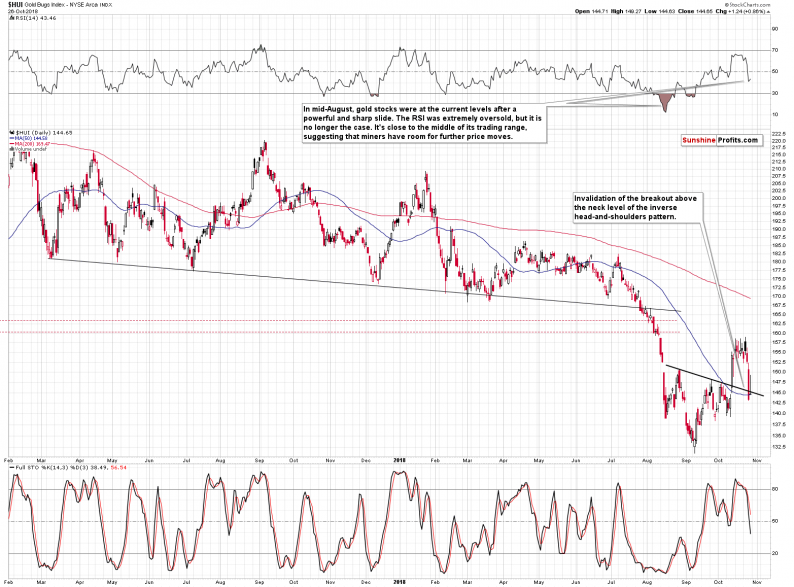
And so it happened. Gold stocks closed the week below the neck of their inverse head-and-shoulders pattern, while the USD Index closed it above its own inverse H&S. The implications thereof are strongly bearish for gold, silver, and mining stocks and we can say the same about gold’s shooting star candlestick that formed on Friday… And that’s not even close to being everything that happened and changed in the last few trading days. There are myriads of factors that are in place right now and if one wants to trade and invest in the precious metals market successfully, they should definitely not be ignored.
We have quite a lot to show you today, so let’s jump right into the charts, starting with the gold stocks.
The Inverse Head-and-Shoulder Patterns
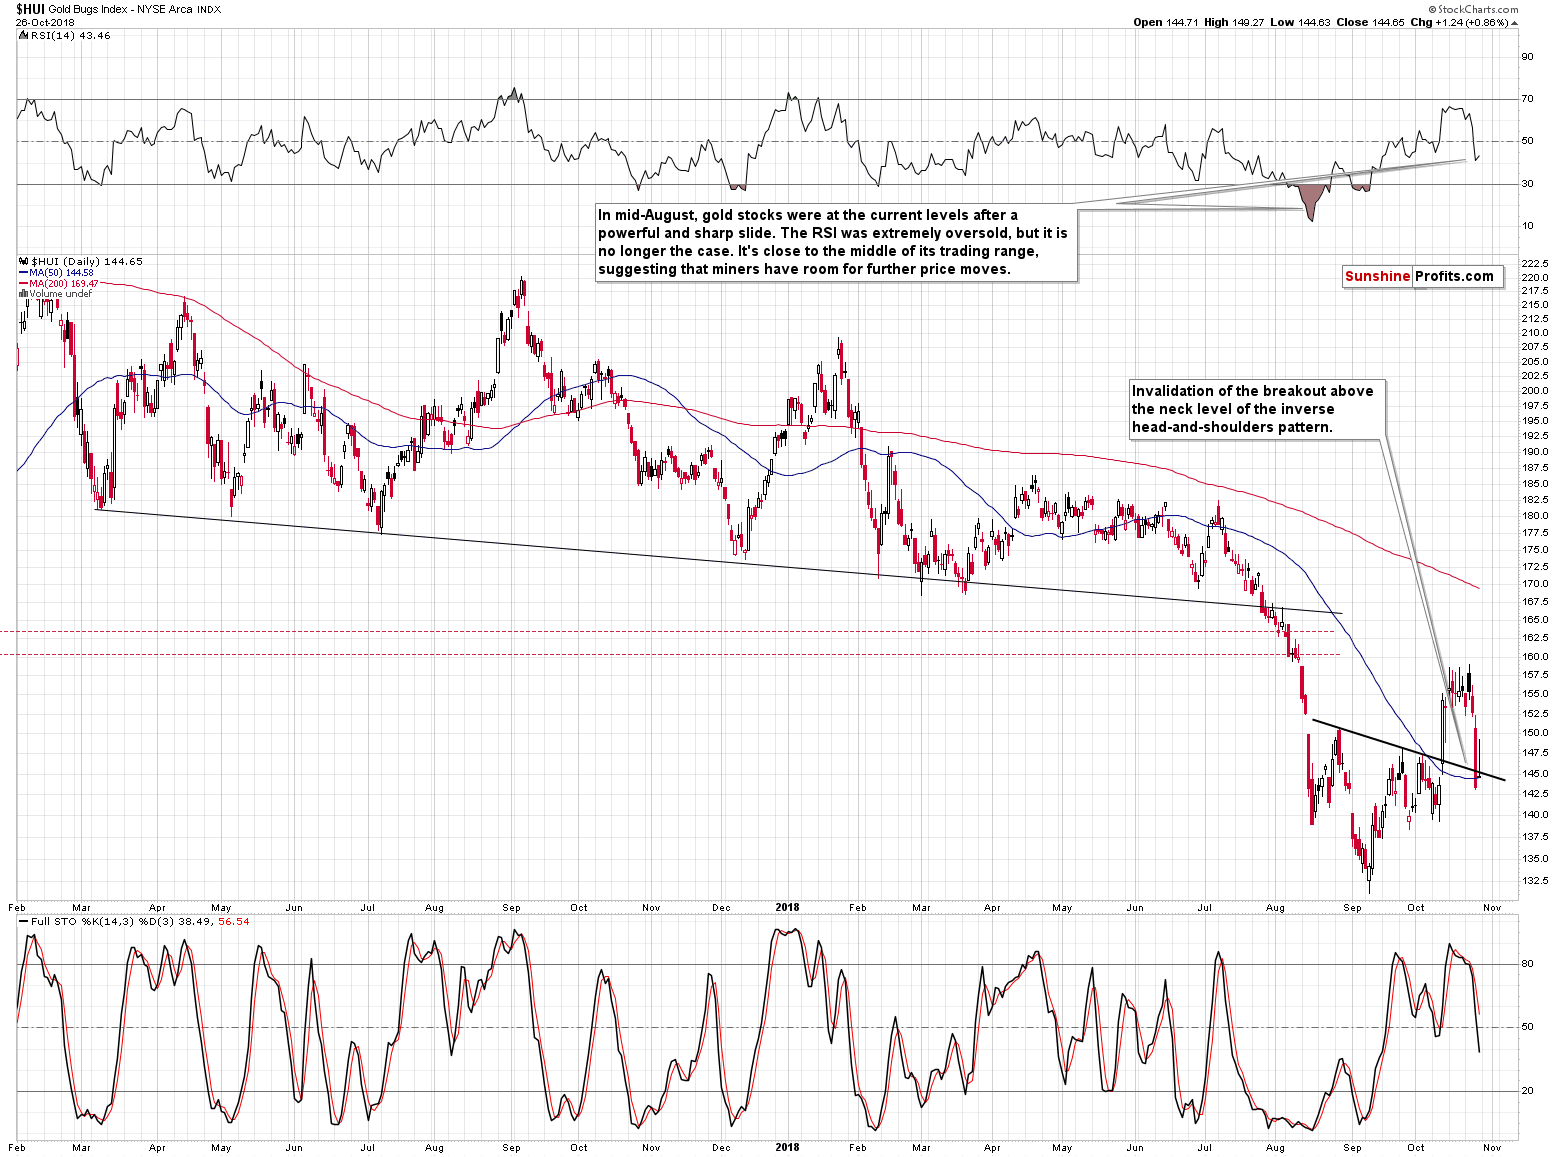
The HUI Index moved higher initially on Friday, but almost the entire daily rally was erased as the gold miners reversed and closed a bit below the opening price. This is a profound bearish sign, because of three things:
In Friday’s analysis, we showed that this invalidation was seen also in case of the gold stocks to gold ratio. Today, we’ll show you that it is also present in case of silver mining stocks.
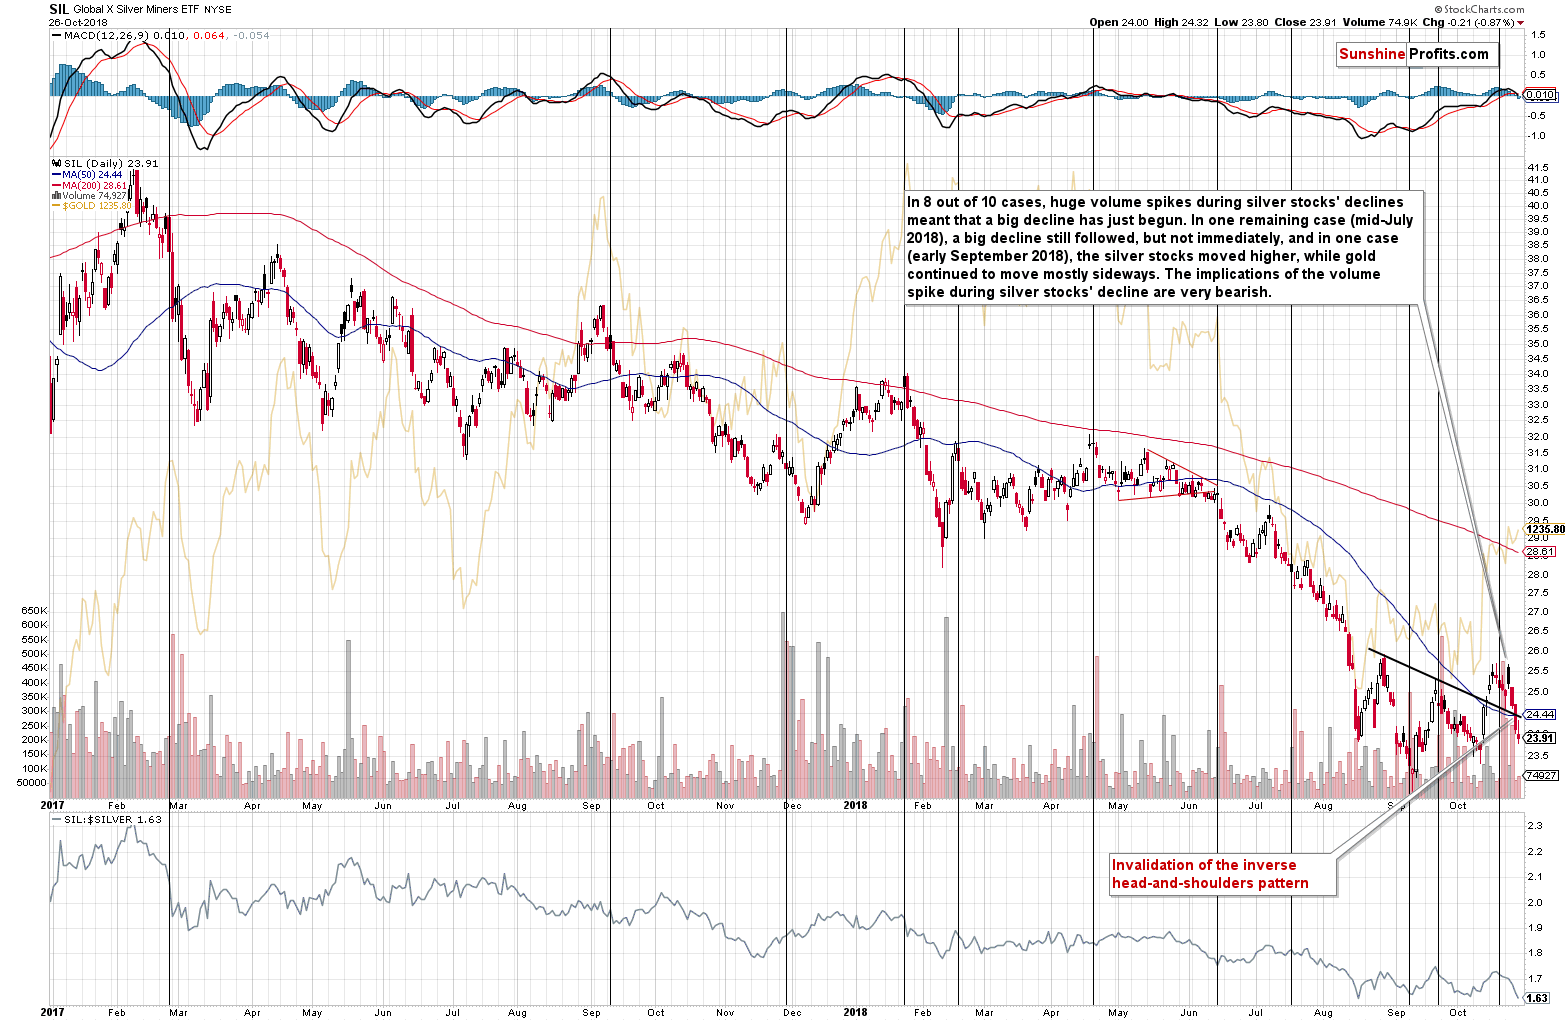
As you can see on the above chart, silver miners closed the week well below the neck level of the inverse H&S formation. The implications are clearly bearish.
Naturally, it’s nothing unexpected – last Monday, we wrote the following regarding the huge volume spikes in the SIL ETF (proxy for the silver stocks):
We just saw a spike in the volume of silver stocks during their daily decline. Why is this important? Because in the recent past it almost always meant lower PM prices.
In 8 out of 10 cases, huge volume spikes during silver stocks’ declines meant that a big decline has just begun. In one remaining case (mid-July 2018), a big decline still followed, but not immediately, and in one case (early September 2018), the silver stocks moved higher, while gold continued to move mostly sideways. The implications of the volume spike during silver stocks’ decline are very bearish.
We saw yet another decline after the previous spike, so the up-to-date statistic is 9 out of 11.
Let’s stay with the inverse head-and-shoulders pattern for a while, while changing the sector.
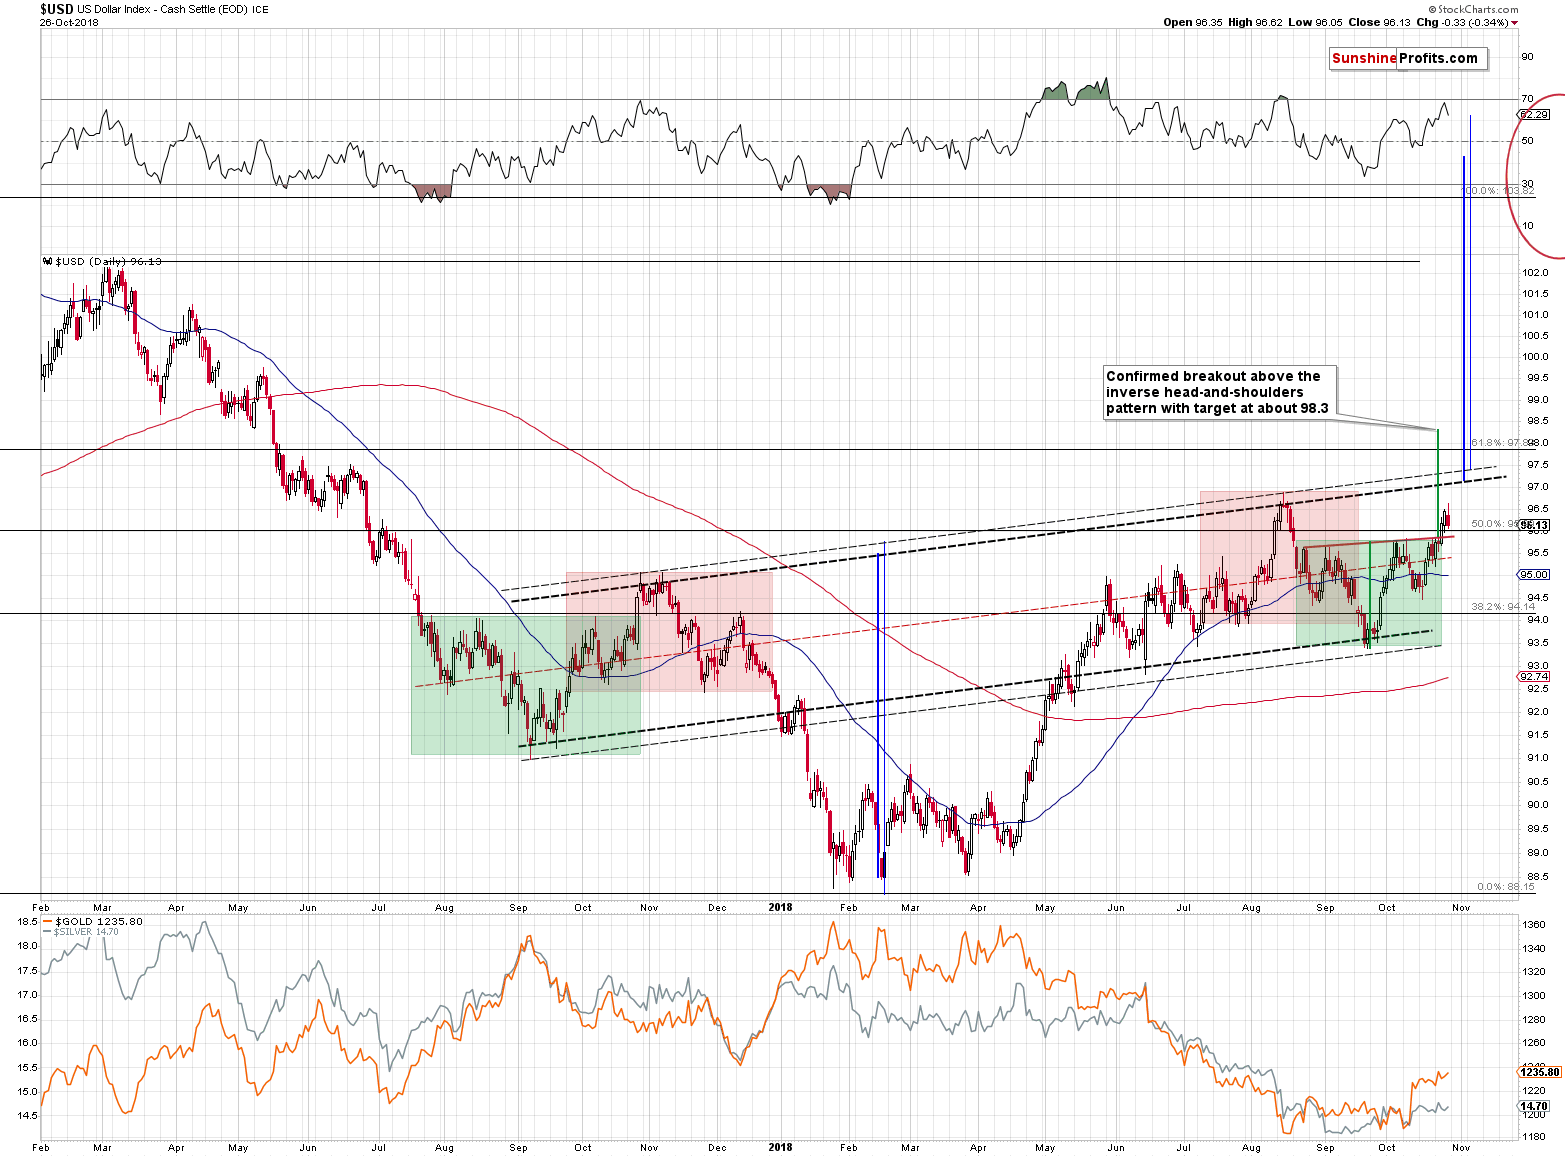
For three consecutive days, the USD Index closed the day visibly above the neck level of its inverse head-and-shoulders pattern. We got additional confirmation from the weekly closing price. The breakout above the local (marked with green) neck level of the inverse head-and-shoulders pattern is now complete and confirmed.


Leave A Comment