
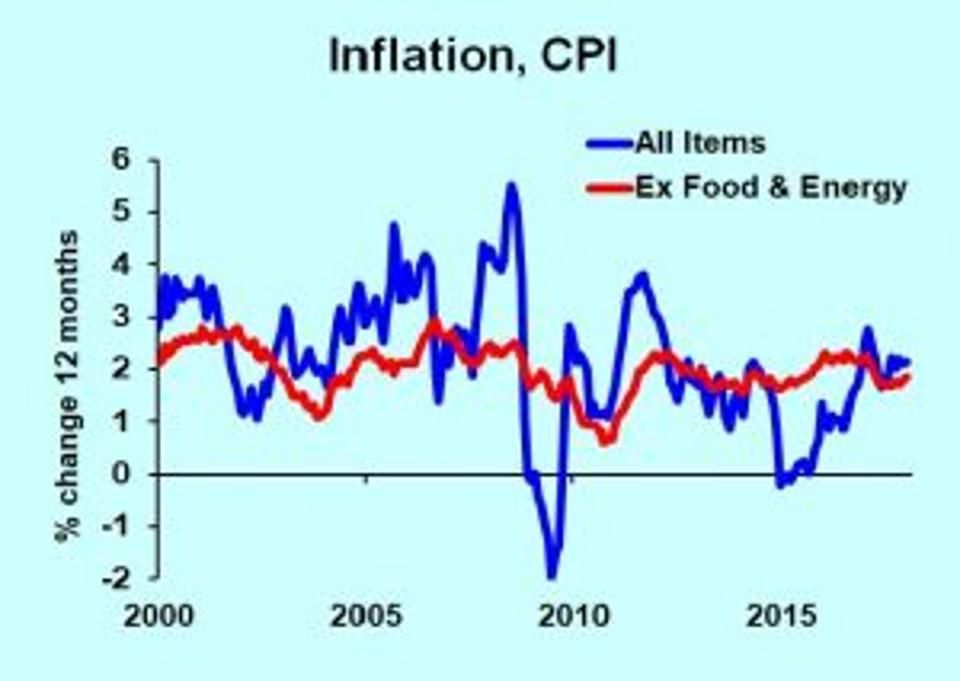
Inflation is accelerating, or not, depending on how you look at the data. A common approach is to measure the Consumer Price Index change over the past 12 months, which generates a rousing ho-hum. Since last August, every report has been between 2.0 and 2.2 percent, with the most recent value square in the middle at 2.1. The alarming viewpoint, though, shows last month was the highest inflation since 2005.
Let’s deconstruct this to see how alarmed we really should be. First, the usual CPI includes everything consumers buy, but it gets pushed up and down by two volatile components: food and energy. Stripping these out leaves a concept called “core inflation.” You are thinking, “But I buy food and energy.” Yes, but including them gives us a misleading guide to inflation.
Dr. Bill Conerly based on data from Bureau of Labor Statistics
Inflation rate
Look at the first chart. That spike in 2008 was short-lived, followed by a sharp drop in 2009. Other gyrations told the same story: high total inflation, or low total inflation, is usually reversed pretty quickly.
Core inflation, on the other hand, helps us see the trend. The decline in core inflation from 2006 to 2009 foretold a lower tend rate of inflation in future years.
Dr. Bill Conerly based on data from Bureau of Labor Statistics
Consumer Price Index
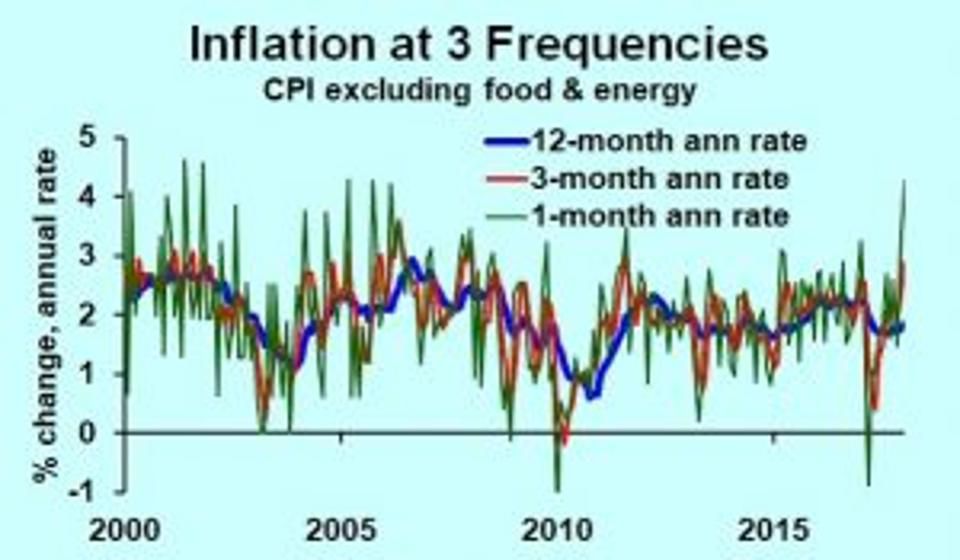
The next issue to explore is the time period of the change. Month-to-month changes are far more pronounced than the 12-month change. Take a look at the second chart, showing changes calculated over three different time periods. (The three- and one-month changes have been annualized by raising the ratio of values to the fourth power or twelfth power.)
It’s clear that the 12-month change smooths the data pretty well. The one-month change spikes up, then down, quite a bit. The problem with the smoother method is that months of rising inflation can go by before the observer sees a clear change in the 12-month percentage change.


Leave A Comment