
BTC/USD Daily
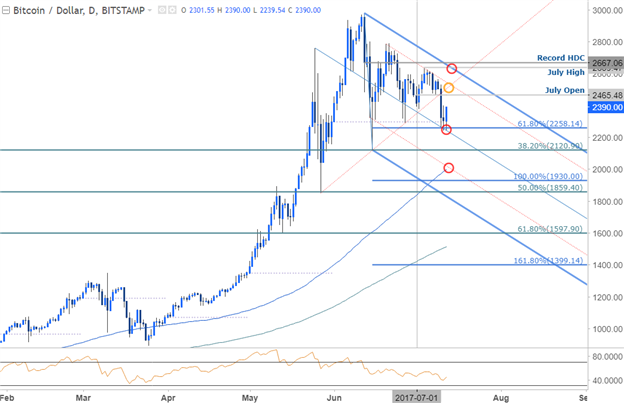
Technical Outlook: Bitcoin responded to a key support confluence this week at 2258 where the 61.8% extension of the decline off the record highs converges on basic median-line support. This threshold may continue to offer a near-term reprieve but the medium-term outlook remains tilted to the downside after Sunday’s breakdown. Interim resistance stands with the monthly open 2465 with a breach / close above the 2017 high-day close at 2667 needed to mark resumption of the broader uptrend.
BTC/USD 240min
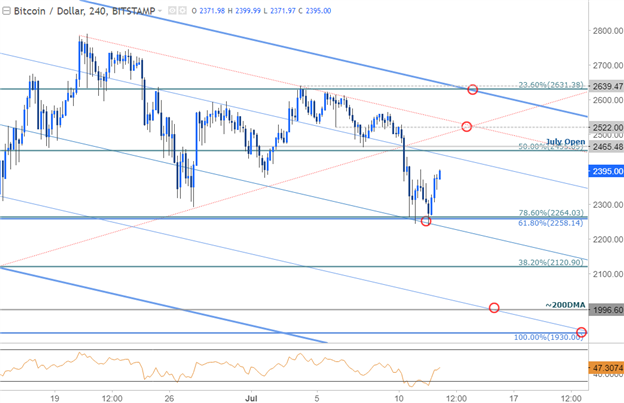
Notes: A closer look at the 240min chart sees bullish divergence into these recent lows, further highlighting the risk for a near-term recovery in the pair (note that the pair is on pace to post an outside-day reversal off the lows today).
That said, look for initial resistance at 2455/65 backed by the median-line confluence around ~2522– both areas of interest for possible near-term exhaustion / short-entries. If the early-month breakdown is an indication of a turn in broader trend, price should not exceed 2640.
Interim support remains with the Fibonacci confluence at 2258/64 with a break below the median-line targeting subsequent support objectives at 2120 & the 200-day moving average, currently ~1996. From a trading standpoint, the immediate risk is for the rebound to drift higher here but ultimately, the outlook remains bearish while within this formation / below the monthly range highs.
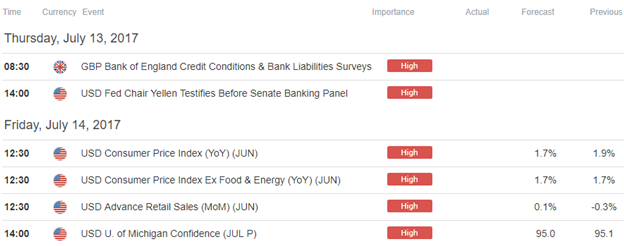
Relevant Data Releases


Leave A Comment