
The US stock market has had a rough ride since last summer, dispensing a run of dark signals that align with bear-market forecasts (see here and here, for instance). Does the rally in recent weeks mark a return of the bull market? Maybe, but the evidence is still thin for deciding that the bear-market bias has passed. To understand why, let’s review some numbers.
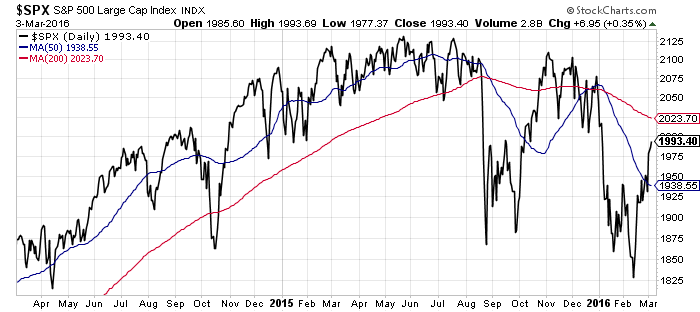
Momentum for US stocks is still skewed to the downside, based on moving averages. For instance, the 50-day average of the S&P 500 remains well below its 200-day counterpart. That doesn’t mean the recent rebound can’t roll on. But for the moment it looks like we’re in that dreaded head fake known as a bear-market rally. At some point it may be time to abandon that view. An early down-payment on that possibility would be if the S&P rises above its 200-day average. But with yesterday’s close (Mar. 3) roughly 30 points below the 200-day average, there’s still a long way to go to close that gap.
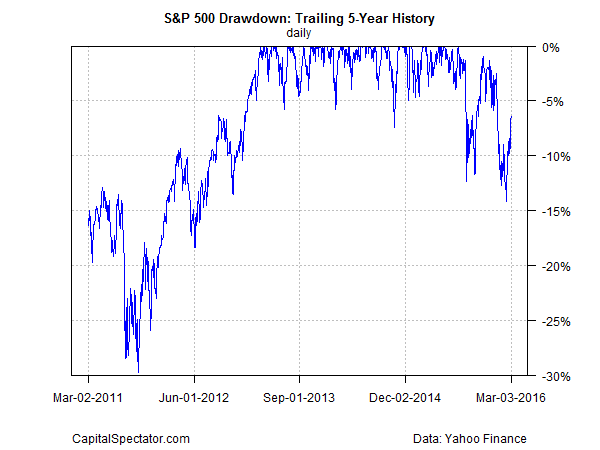
Meantime, the S&P’s drawdown (DD) has eased, offering a bit of good news for looking ahead and hoping for better days. In particular, note that the market’s recent rebound has pared DD to a relatively mild 6.5% as of yesterday. That’s an encouraging retreat from last month’s brief tumble below the negative 10% line, which is relatively rare but with a history of signaling extended bouts of market weakness.
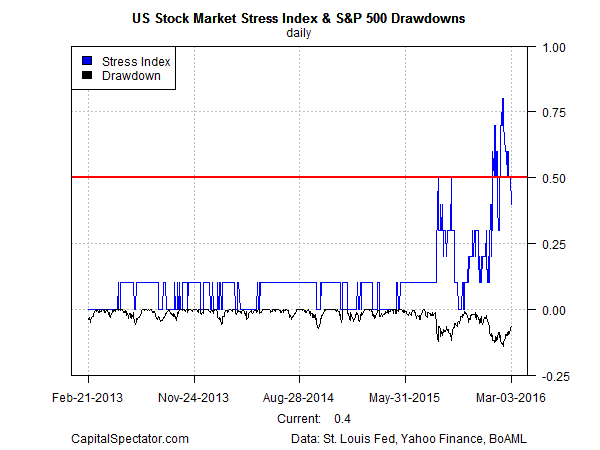
Note too that equity market stress has eased lately, based on the ten-factor US Stock Market Stress Index (US-SMSI). Note: this was formerly labeled US Crash Risk Index; the new title offers a clearer description of the benchmark’s design intentions. The index’s calculation rules, however, are unchanged—see this primer for details. The key point is that the US-SMSI has dipped below the critical 0.5 mark for the first time in several weeks, settling at 0.4 yesterday.
It doesn’t hurt that the economic numbers of late have been upbeat. Not surprisingly, several business-cycle benchmarks point to ongoing economic growth. The current reading of the Philly Fed’s ADS Index, for example, is a healthy +0.18, based on data reflecting economic activity through Feb. 27—well above the level that’s been associated with the onset of recessions, which is depicted in the red line in the chart below.


Leave A Comment