
I warned in early October that stocks looked like they were setting up for another sharp crash into the height of the “crash season” in mid-October.
Instead, we got rate cuts in China, rumblings of stronger QE in Europe, and a continued rally at home.
In other words – central banks delayed the inevitable. Again.
So let’s look at where the markets are today…
In the revised paperback version of The Demographic Cliff back in the summer, I gave two scenarios for an impending peak in stocks. The chart gave leeway for a potential new high, which is why you see two large “5’s” at the top there:
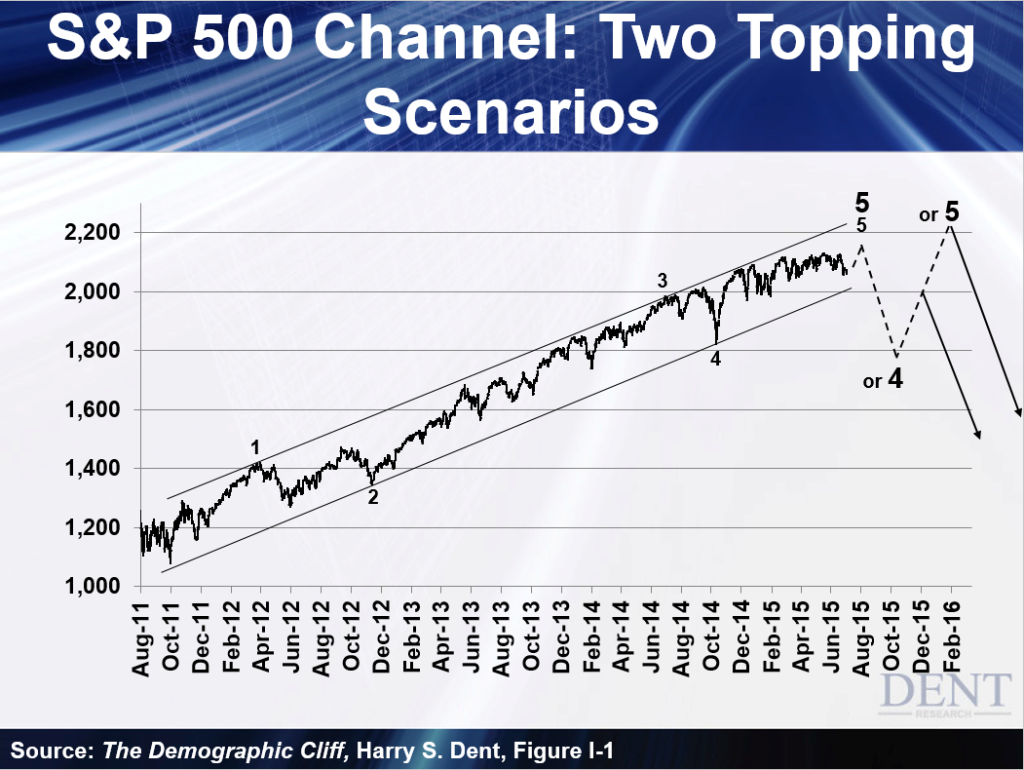
In both scenarios, we would see a break of the narrow and bubbly channel that had been rising since late 2011.
We got that.
The question was… how high would they bounce after that initial breakthrough?
The first scenario was the S&P 500 would fall toward 1,800 and then have a two-wave rally back toward 2,000.
That still looked likely at the beginning of October… back when oil and China’s Shanghai Composite Index were trading in a narrow range. That suggested another short crash to follow.
Clearly that wasn’t the case. The S&P 500 breached 2,100 and came to within a percent of its peak.
So, scenario two took the cake… wherein the large cap markets would make slight news highs, or at least come close to retesting those highs. The Nasdaq 100 actually did make a very slight new high last week before pulling back.
If the markets outside of that index fail to make new highs – folks, that’s a bearish signal if I ever saw one.
But even if they do make slight new highs… that would very likely set up a number of major divergences as Adam has been pointing out.
Damned if we do, damned if we don’t.
Either way, it doesn’t look good.
And we’re already seeing such divergences. Over 50% of S&P 500 stocks are trading below their 200-day moving average. Investors have grown very selective, favoring only the largest stocks.


Leave A Comment